Fig. 8.
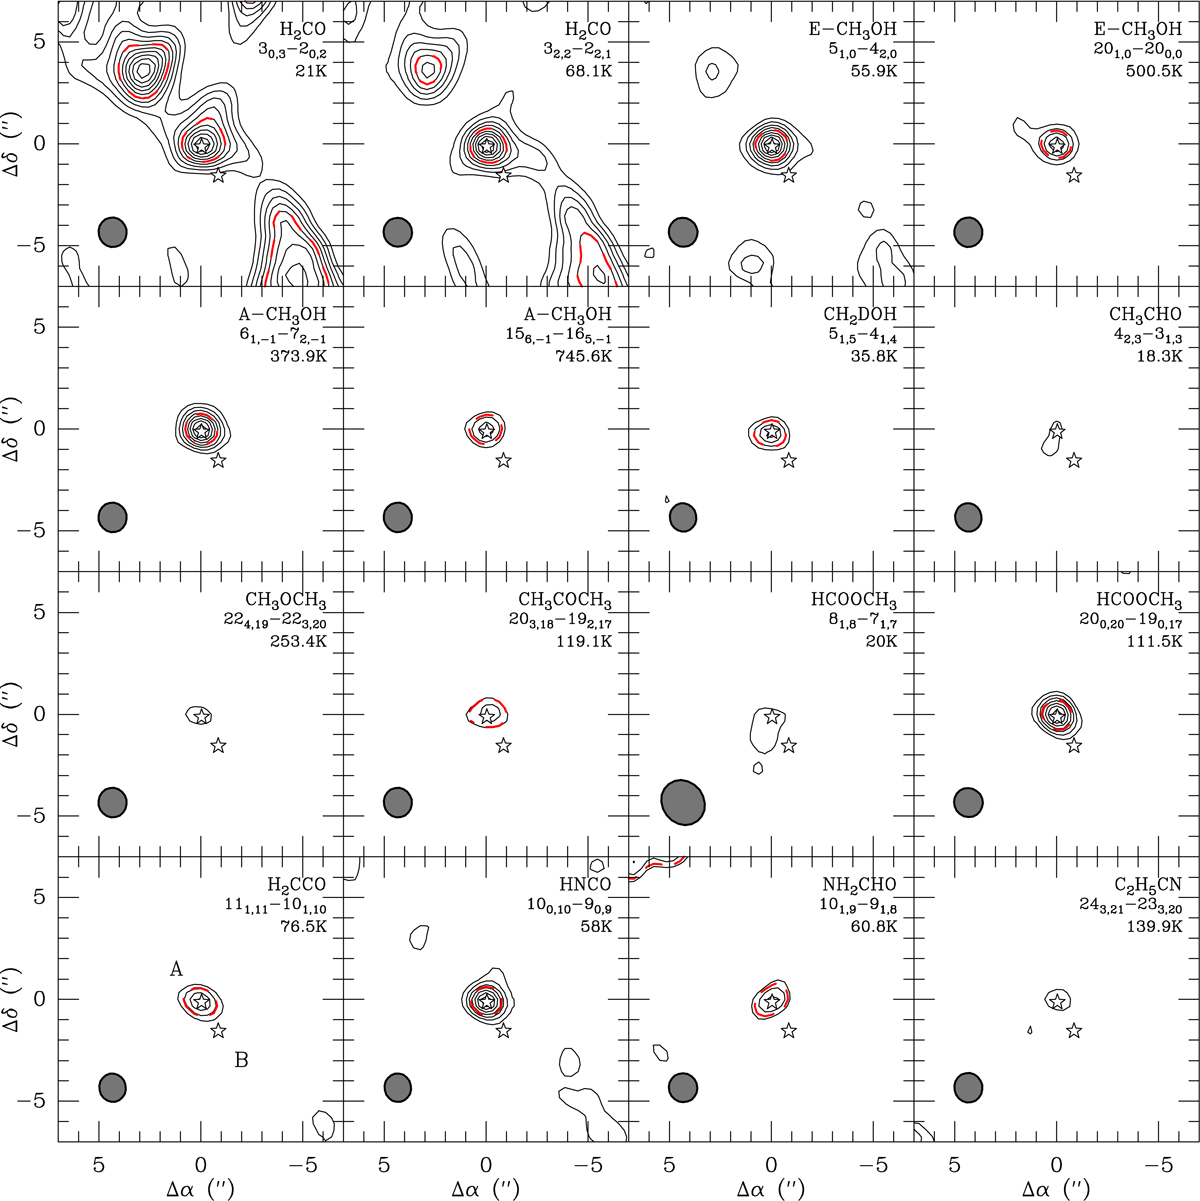
Integrated emission maps of COMs and chemically related species. For H2CO, base contour and contour spacing are 10% of the maximum integrated intensity. For the E-CH3OH map, base contour and contour spacing are 3σ. For the others molecules, base contour and contour spacing are 3 and 2σ of each map. Red-dashed lines corresponds to half maximum intensity if it is greater than 3σ noise. The locations of Cep E-A and Cep E-B are marked by stars.
Current usage metrics show cumulative count of Article Views (full-text article views including HTML views, PDF and ePub downloads, according to the available data) and Abstracts Views on Vision4Press platform.
Data correspond to usage on the plateform after 2015. The current usage metrics is available 48-96 hours after online publication and is updated daily on week days.
Initial download of the metrics may take a while.