Fig. 5.
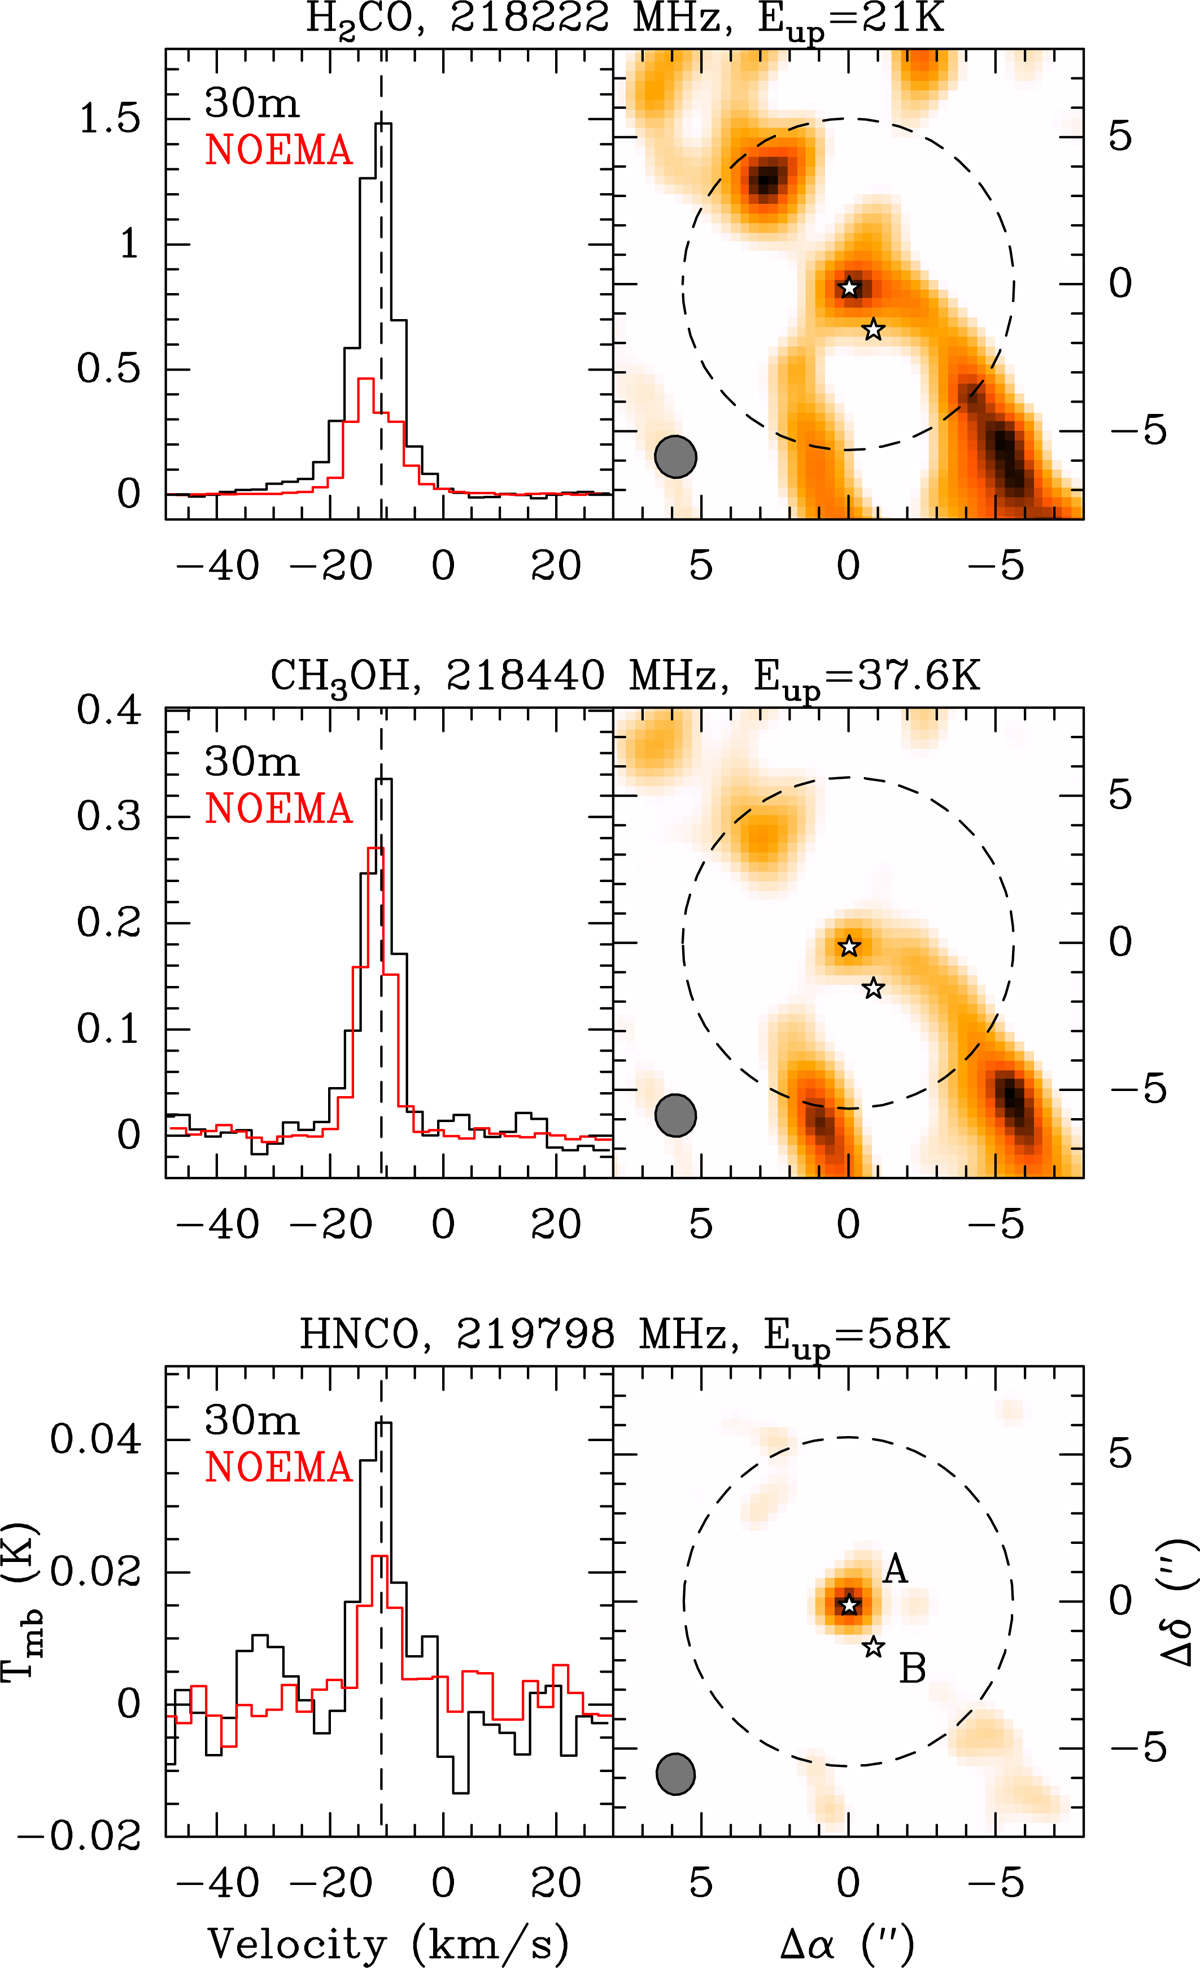
H2CO 30,3−20,2,CH3OH 42,0−31,0 and HNCO 100,10−90,9 transitions detected with both IRAM 30 m and NOEMA towards Cep E-mm. Left: 30 m spectra (black) and NOEMA spectra convolved to the single-dish beam (red). Both spectra are displayed with the same spectral resolution. The black dashed line marks the cloud velocity νlsr = −10.9kms−1. Right: emission map obtained with NOEMA. The interferometric synthesised beam is represented by the grey disc. White star marks the observing position of the 30 m and the beam width at half-power is drawn by a black dashed circle. The locations of protostars Cep E-A and Cep E-B are marked by stars.
Current usage metrics show cumulative count of Article Views (full-text article views including HTML views, PDF and ePub downloads, according to the available data) and Abstracts Views on Vision4Press platform.
Data correspond to usage on the plateform after 2015. The current usage metrics is available 48-96 hours after online publication and is updated daily on week days.
Initial download of the metrics may take a while.