Fig. 3.
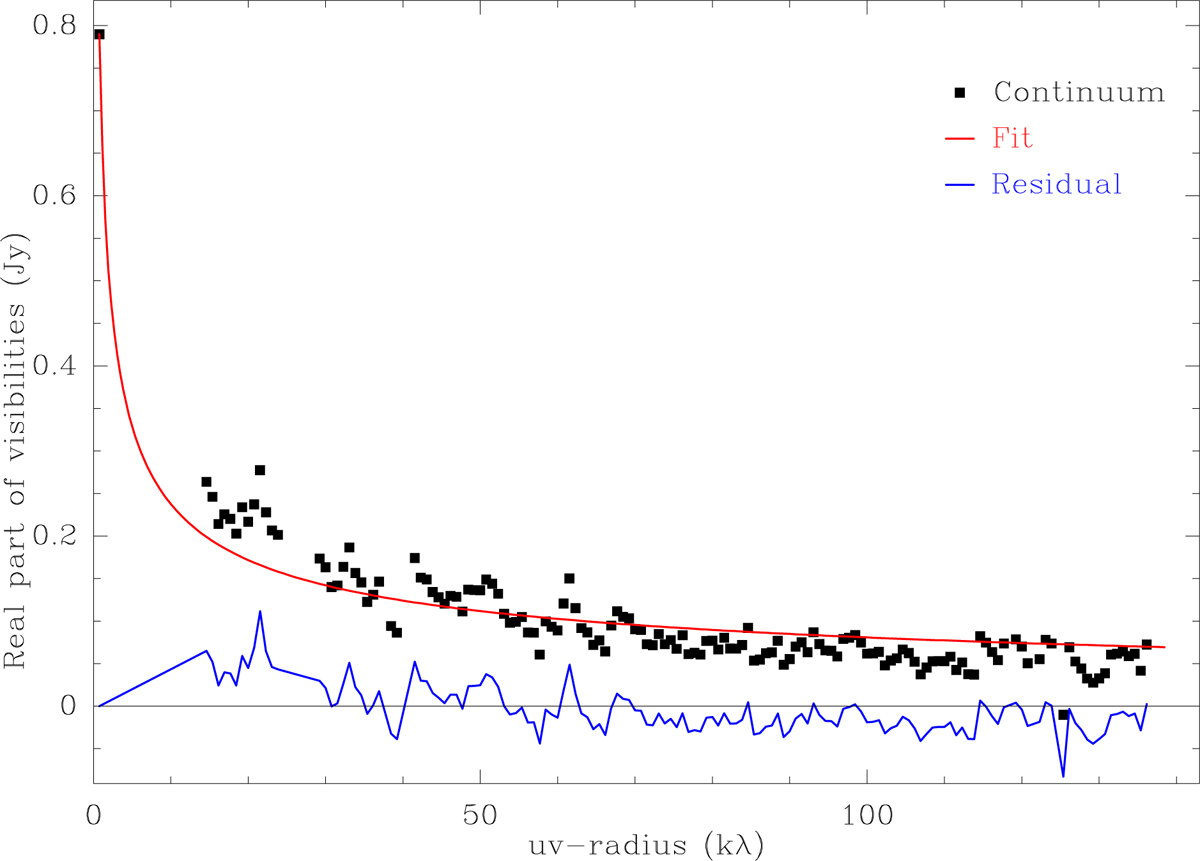
Continuum (real part of the visibilities, black squares) and corresponding best-fit power-law model (red line) averaged over baseline bins of 1 m, as a function of baseline length. Residuals are shown as a blue line. The zero-spacing 790 mJy flux density is extrapolated from single-dish observations at 1.3 mm by Lefloch et al. (1996).
Current usage metrics show cumulative count of Article Views (full-text article views including HTML views, PDF and ePub downloads, according to the available data) and Abstracts Views on Vision4Press platform.
Data correspond to usage on the plateform after 2015. The current usage metrics is available 48-96 hours after online publication and is updated daily on week days.
Initial download of the metrics may take a while.