Fig. 2.
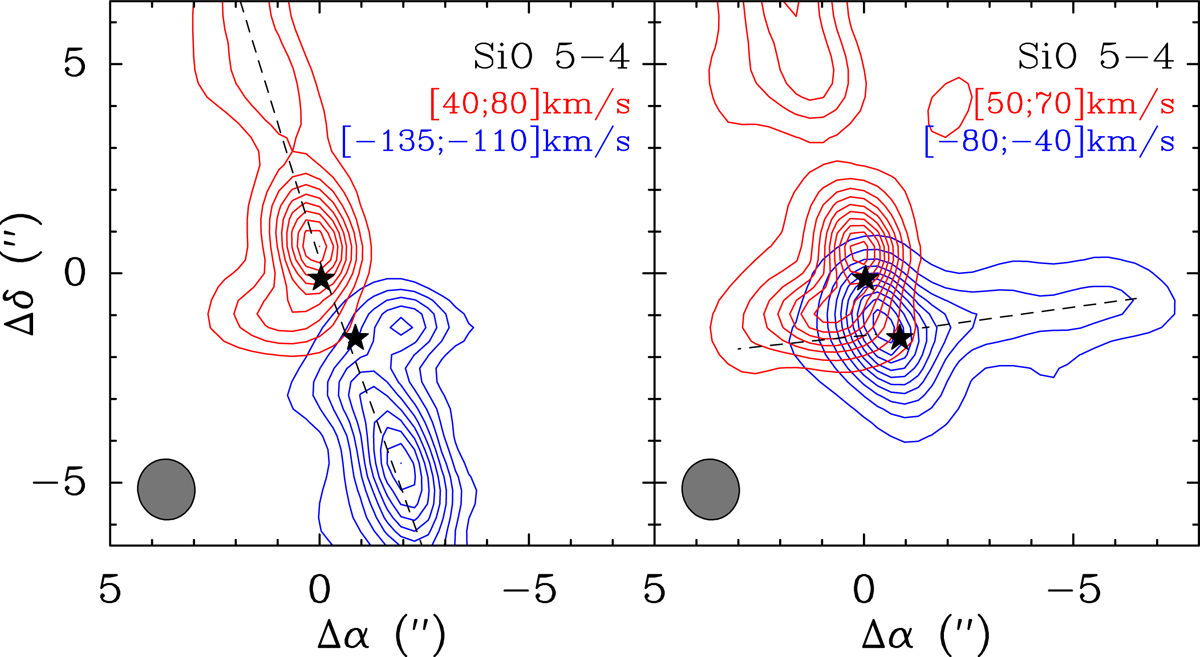
SiO J = 5−4 jet emission. The stars points towards the fitted position of both Cep E-A and B cores. Left: the blue and red contours represent the integrated line emission between −135 and −110 km s−1 and between +40 and +80 km s−1, respectively. Base contour and contour spacing of both jet emission are 10% of their maximum intensity. Right: the blue and red contours represent the integrated line emission between −80 and −40 km s−1 and between +50 and +70 km s−1, respectively. Base contour and contour spacing of both jet emissions are 5% and 10% of their maximum intensity, respectively.
Current usage metrics show cumulative count of Article Views (full-text article views including HTML views, PDF and ePub downloads, according to the available data) and Abstracts Views on Vision4Press platform.
Data correspond to usage on the plateform after 2015. The current usage metrics is available 48-96 hours after online publication and is updated daily on week days.
Initial download of the metrics may take a while.