Fig. 1.
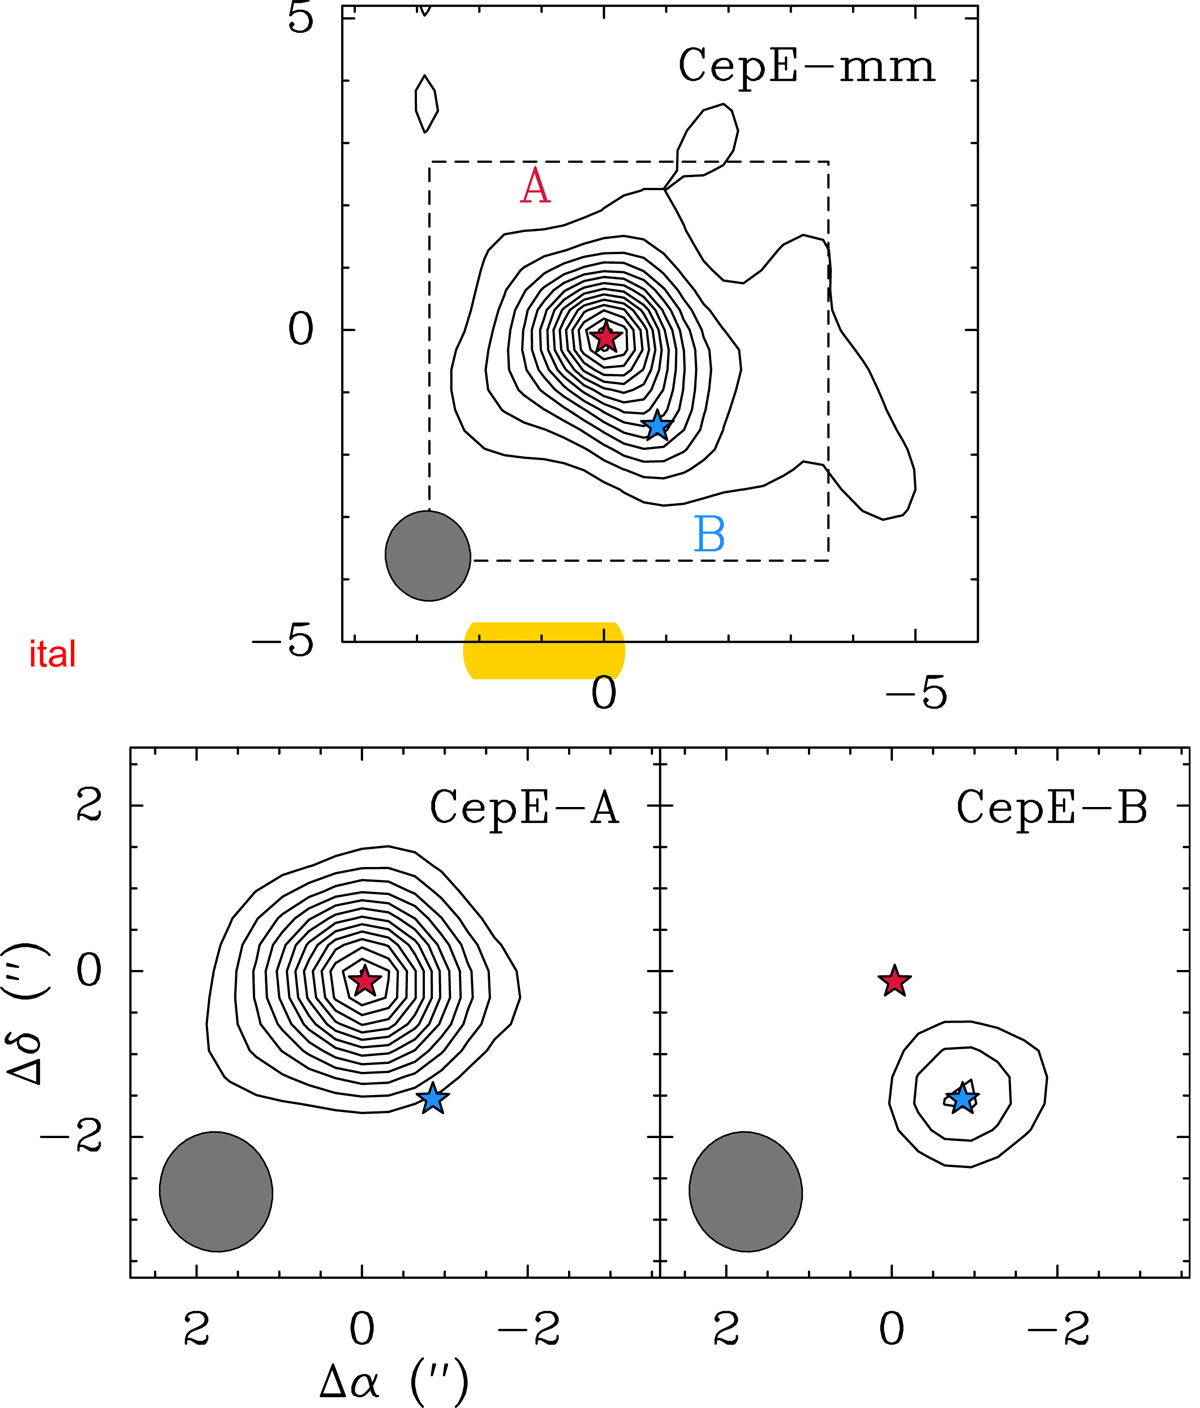
Top: Cep E-mm 1.3 mm continuum map. Base contour and contour spacing are 3.6 (3σ) and 7.2 mJy beam−1 (6σ). The peak intensity is 99.2 mJy/1.42″-beam. The blue and red stars mark the position of Cep E-A and B components, respectively. Bottom: continuum emission of components A (left)andB(right) deduced from a two-component fit to the visibilities (see text). Base contour and contour spacing are 10.8 (9σ) and 7.2 mJy beam−1 (6σ). Peak intensities are 97.1 and 26.2 mJy/1.42″-beam, respectively.
Current usage metrics show cumulative count of Article Views (full-text article views including HTML views, PDF and ePub downloads, according to the available data) and Abstracts Views on Vision4Press platform.
Data correspond to usage on the plateform after 2015. The current usage metrics is available 48-96 hours after online publication and is updated daily on week days.
Initial download of the metrics may take a while.