Free Access
Fig. 8.
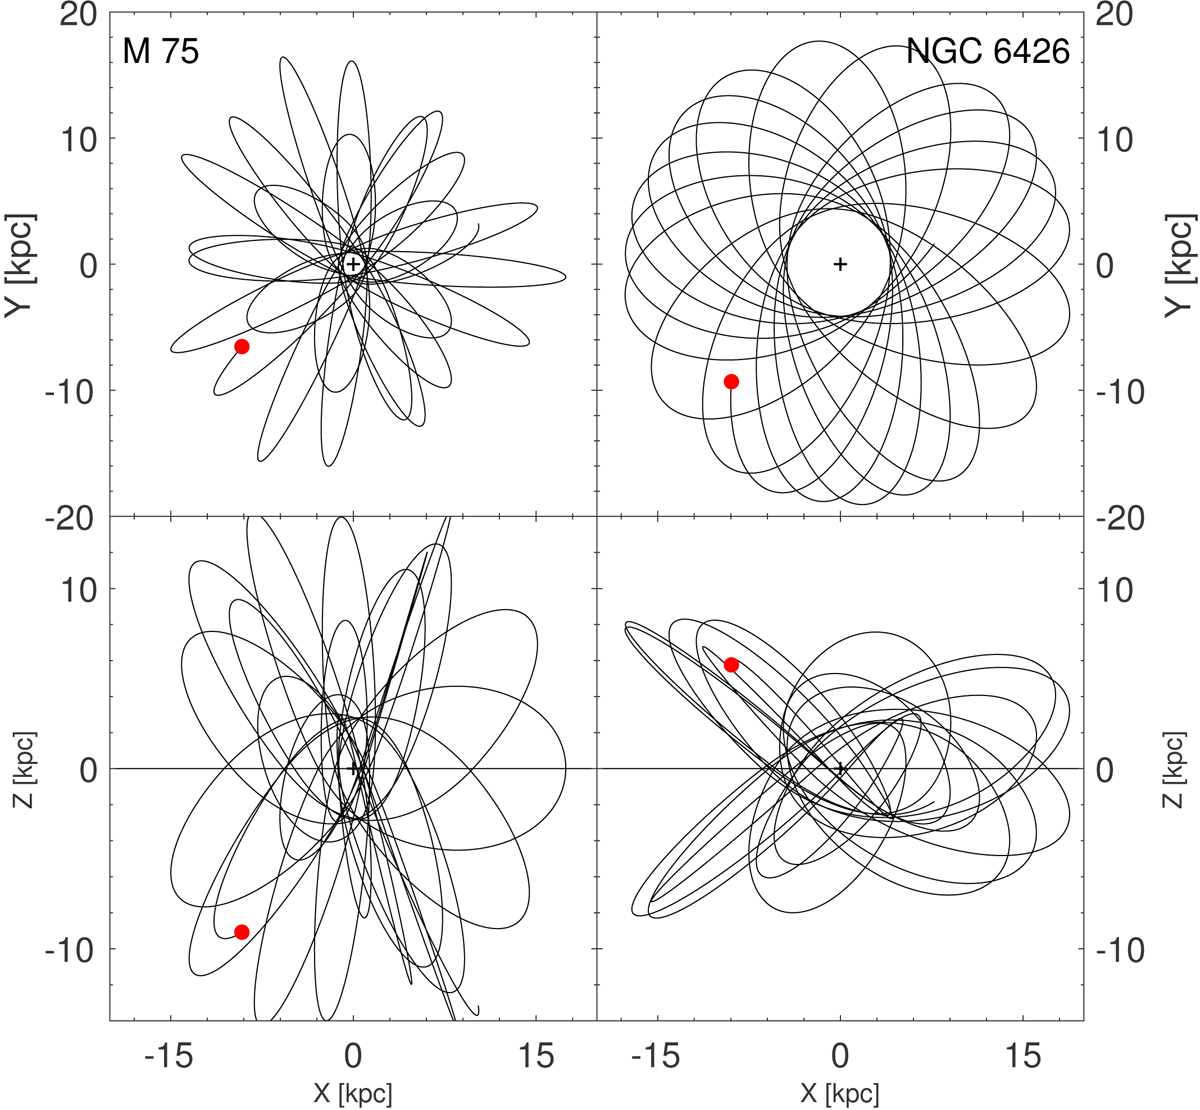
Orbit projections as a result of a backward computation. Only a timeframe of 6 Gyr is depicted. The present location of the GCs is shown as a red point. The cross and line denote the Galactic center and plane.
Current usage metrics show cumulative count of Article Views (full-text article views including HTML views, PDF and ePub downloads, according to the available data) and Abstracts Views on Vision4Press platform.
Data correspond to usage on the plateform after 2015. The current usage metrics is available 48-96 hours after online publication and is updated daily on week days.
Initial download of the metrics may take a while.