Fig. 5.
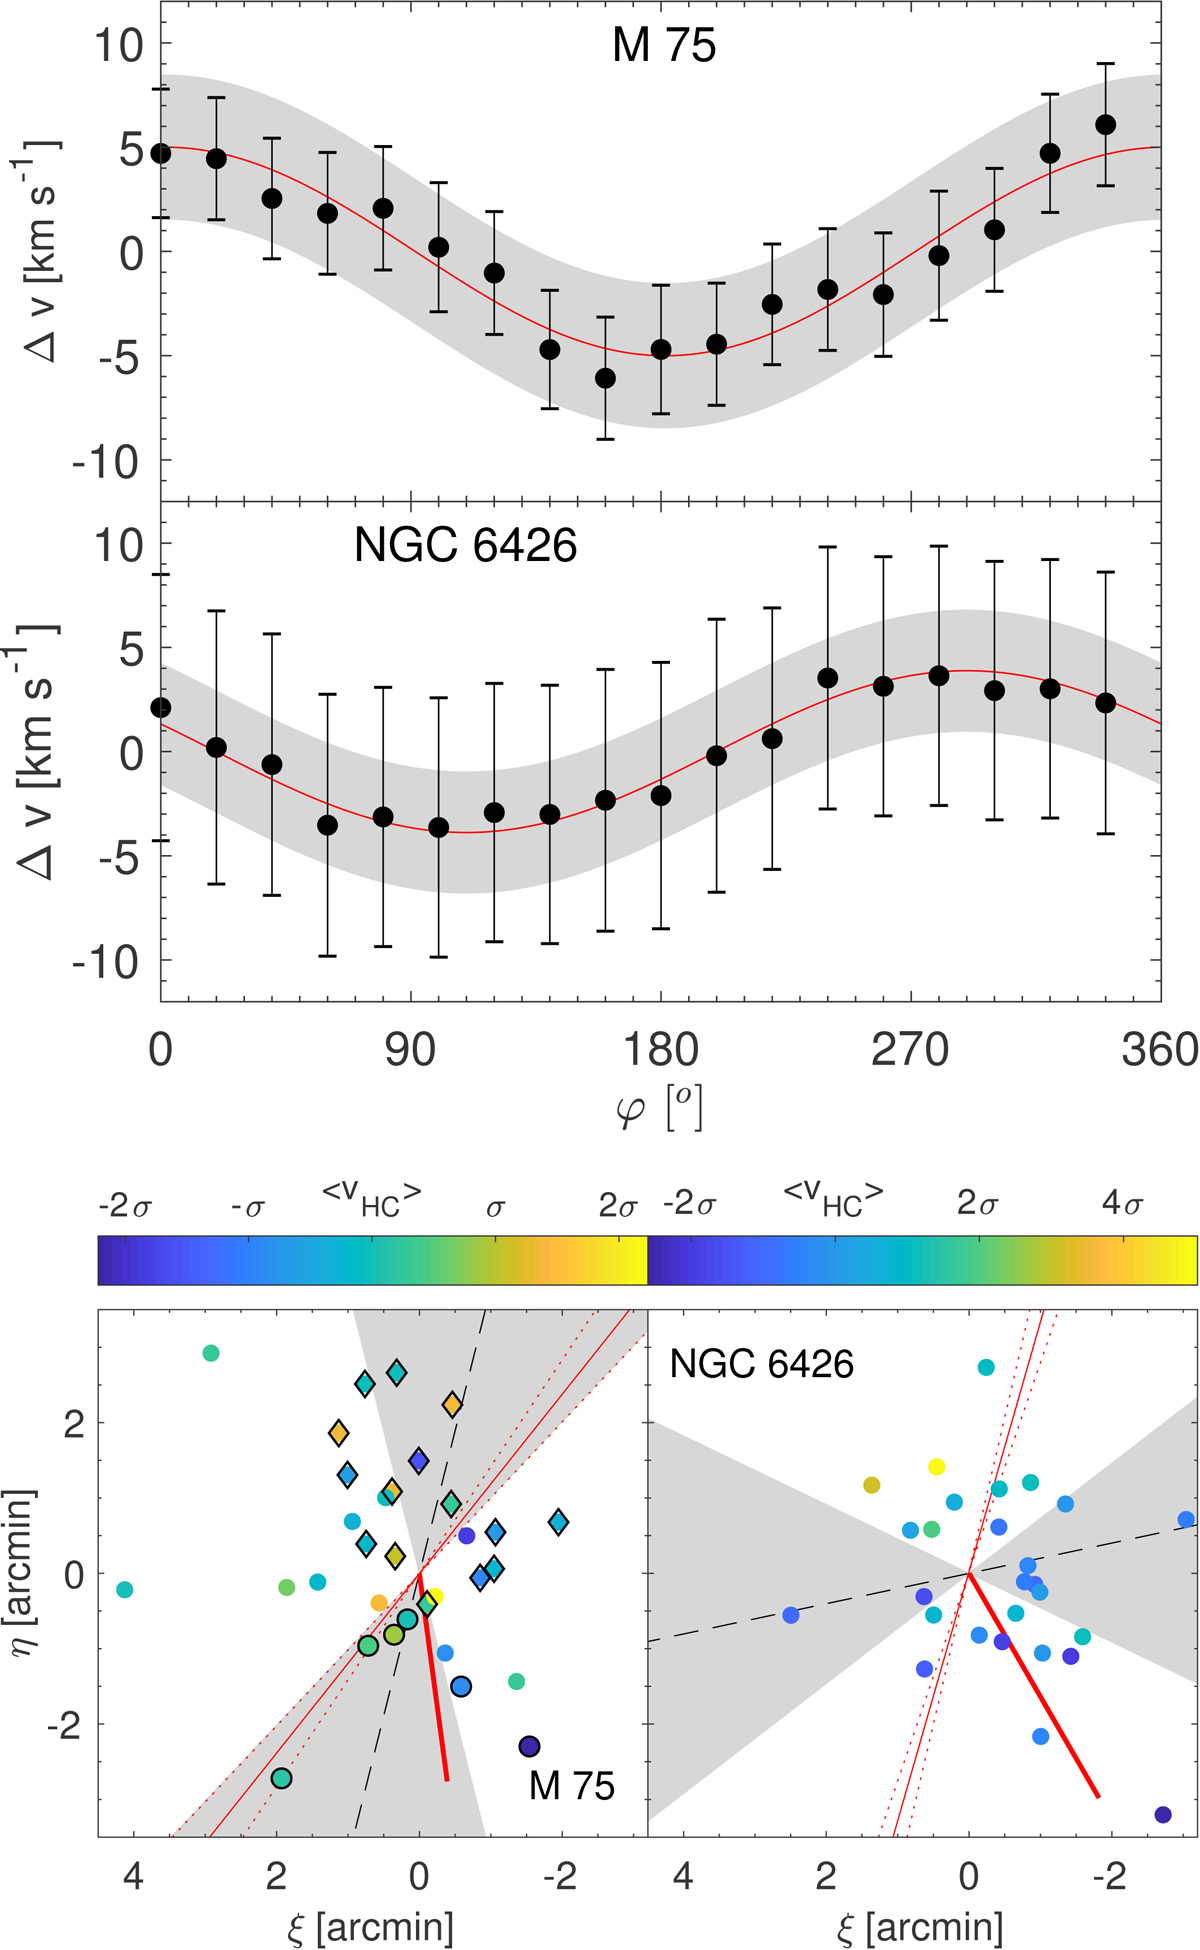
Top panels: Rotation curves and best-fit sinusoidal for both GCs. The bottom panels show the location of the target stars, colour-coded by radial velocity in units of their dispersion. Diamonds refer to M 75 targets on chip #1 on FORS2, circles indicate stars on chip #2, and MIKE targets are shown without extra delimiters. The gray shaded areas indicate the error margin of the rotation axis, which itself is shown as a dashed line. The major axis PAs of each cluster from Chen & Chen (2010) are plotted as thin red lines; finally, the direction of the Gaia DR2 proper motion is shown via a thick red line.
Current usage metrics show cumulative count of Article Views (full-text article views including HTML views, PDF and ePub downloads, according to the available data) and Abstracts Views on Vision4Press platform.
Data correspond to usage on the plateform after 2015. The current usage metrics is available 48-96 hours after online publication and is updated daily on week days.
Initial download of the metrics may take a while.