Fig. 3.
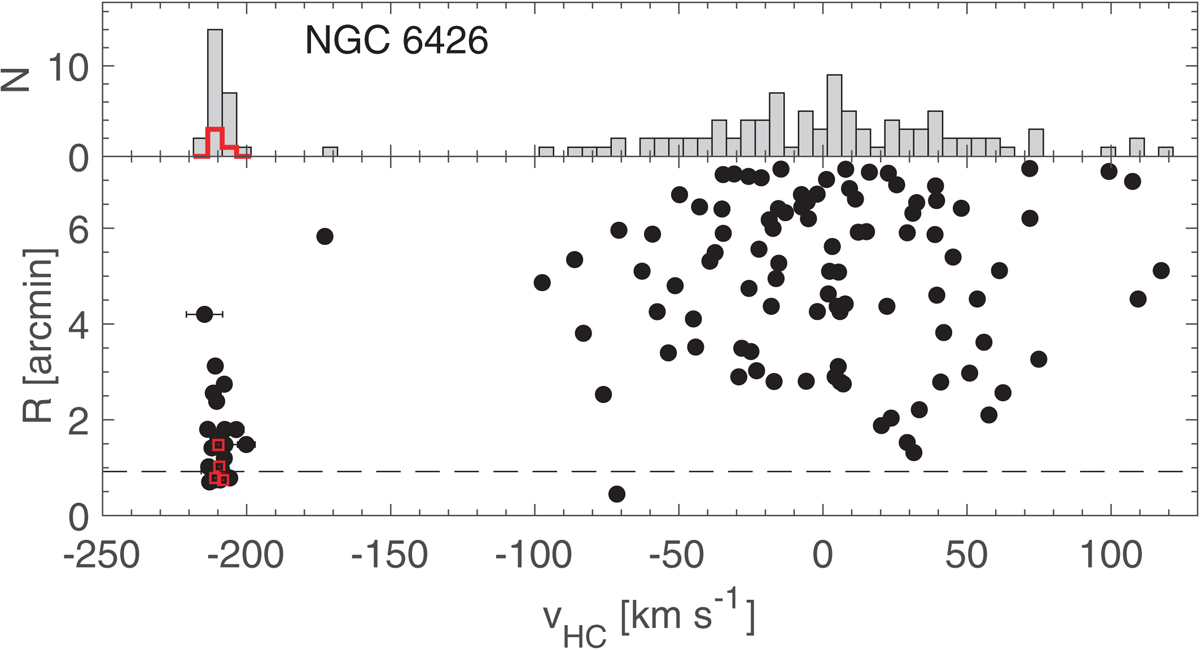
Heliocentric radial velocity against radial distance (bottom panel) for the entire NGC 6426 observations. The histogram in the top panel indicates the peak of the GC at ![]() 210 km s
210 km s![]() . The dashed line in the bottom panel shows the half-light radius of the cluster. Red symbols and the red histogram refer to the MIKE sample of Hanke et al. (2017).
. The dashed line in the bottom panel shows the half-light radius of the cluster. Red symbols and the red histogram refer to the MIKE sample of Hanke et al. (2017).
Current usage metrics show cumulative count of Article Views (full-text article views including HTML views, PDF and ePub downloads, according to the available data) and Abstracts Views on Vision4Press platform.
Data correspond to usage on the plateform after 2015. The current usage metrics is available 48-96 hours after online publication and is updated daily on week days.
Initial download of the metrics may take a while.