Fig. 2.
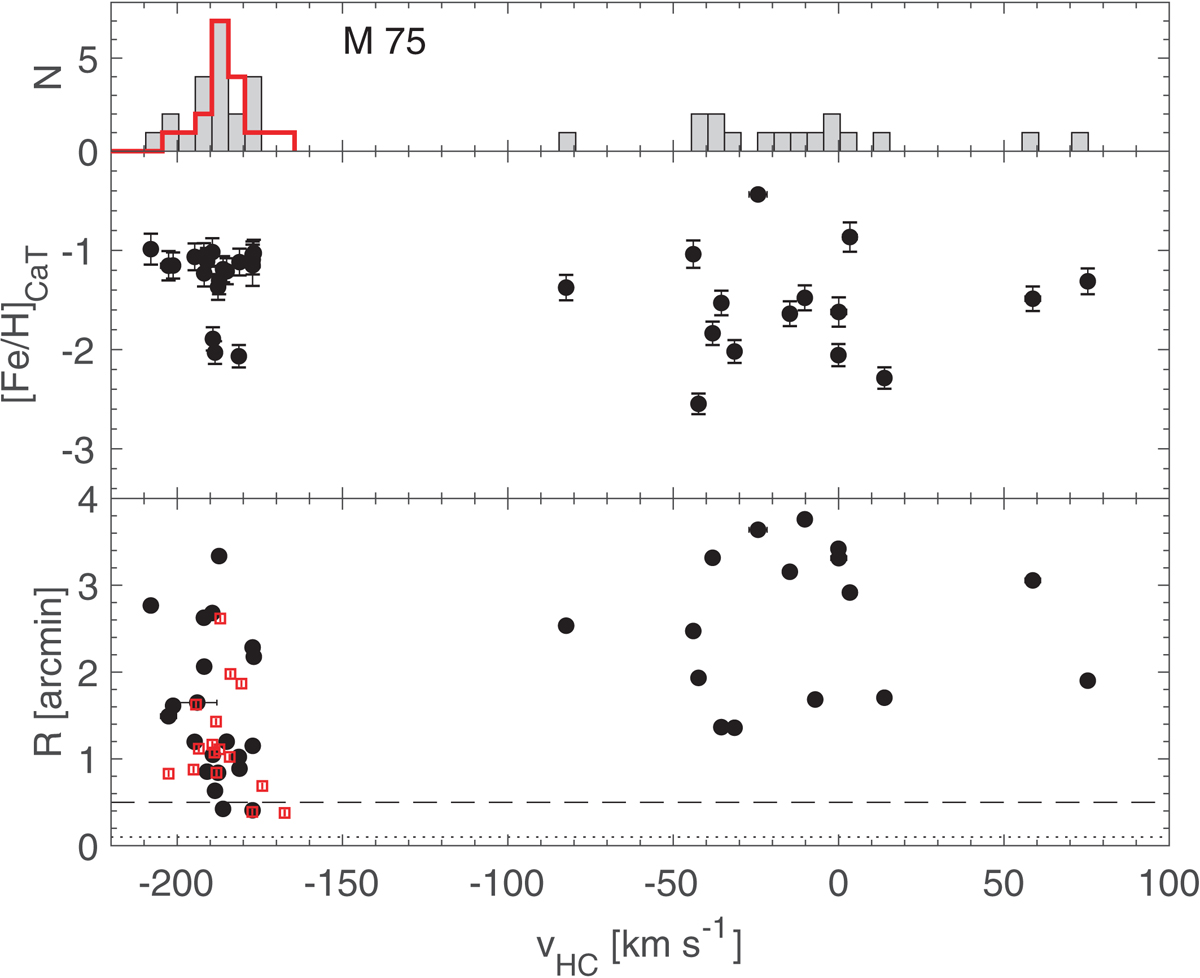
Heliocentric radial velocity against radial distance (bottom panel) and CaT-based metallicity (middle panel) from the FORS data are shown in black. The histogram in the top panel indicates the peak of M 75 at ![]() 188 km s
188 km s![]() , and the dotted and dashed lines in the bottom panel show the core- and half-light radii of the cluster. Red symbols in the bottom panel and the red solid line in the histogram plot refer to the MIKE sample.
, and the dotted and dashed lines in the bottom panel show the core- and half-light radii of the cluster. Red symbols in the bottom panel and the red solid line in the histogram plot refer to the MIKE sample.
Current usage metrics show cumulative count of Article Views (full-text article views including HTML views, PDF and ePub downloads, according to the available data) and Abstracts Views on Vision4Press platform.
Data correspond to usage on the plateform after 2015. The current usage metrics is available 48-96 hours after online publication and is updated daily on week days.
Initial download of the metrics may take a while.