Fig. 3
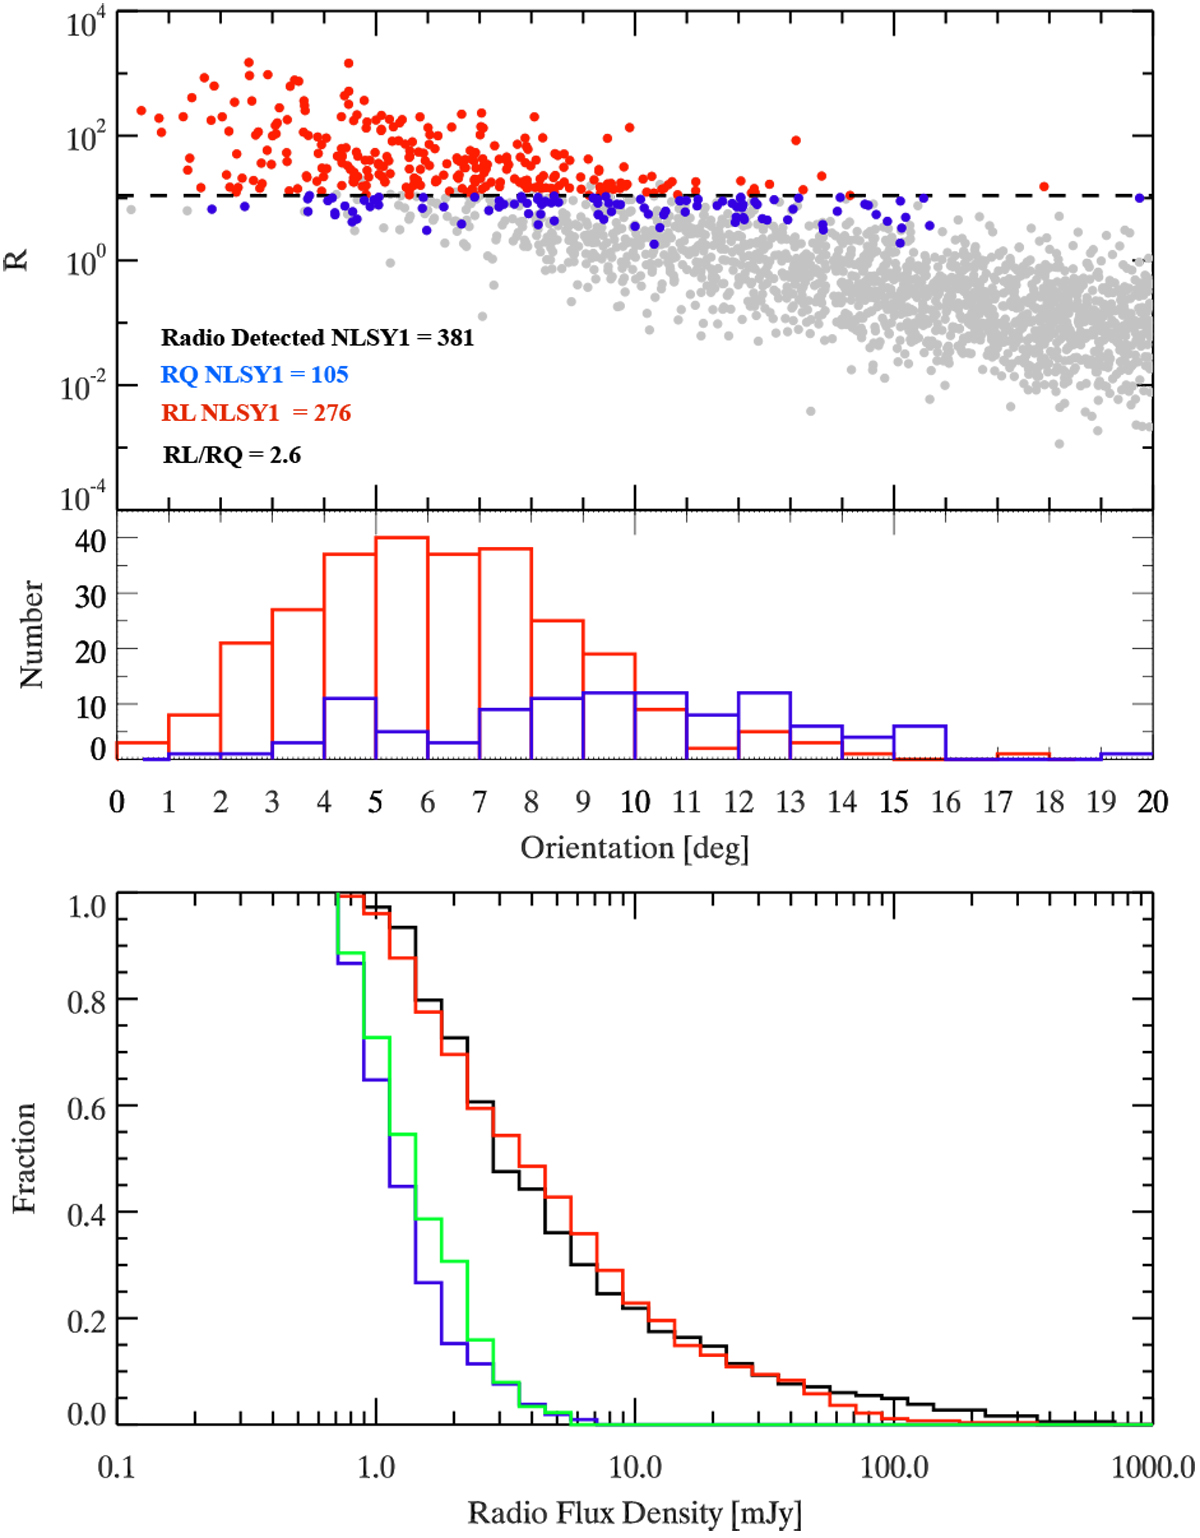
Top panel: radio-loudness as a function of the orientation angle for the simulated NLS1 sample. Middle panel: orientation angle distribution for simulated radio-detected NLS1s. Our simulated samples have average orientations of ![]() (RL-NLS1) and
(RL-NLS1) and ![]() (RQ-NLS1), and we can infer θRL-NLS1 ~ 9°. Bottom panel: radio flux density distributions for simulated and real samples. Red and blue symbols and lines in all panels refer to simulated RL- and RQ-NLS1s, while black and green lines in the bottom panel refers to the observed RL and RQ populations present in Järvelä et al. (2015).
(RQ-NLS1), and we can infer θRL-NLS1 ~ 9°. Bottom panel: radio flux density distributions for simulated and real samples. Red and blue symbols and lines in all panels refer to simulated RL- and RQ-NLS1s, while black and green lines in the bottom panel refers to the observed RL and RQ populations present in Järvelä et al. (2015).
Current usage metrics show cumulative count of Article Views (full-text article views including HTML views, PDF and ePub downloads, according to the available data) and Abstracts Views on Vision4Press platform.
Data correspond to usage on the plateform after 2015. The current usage metrics is available 48-96 hours after online publication and is updated daily on week days.
Initial download of the metrics may take a while.