Fig. 2
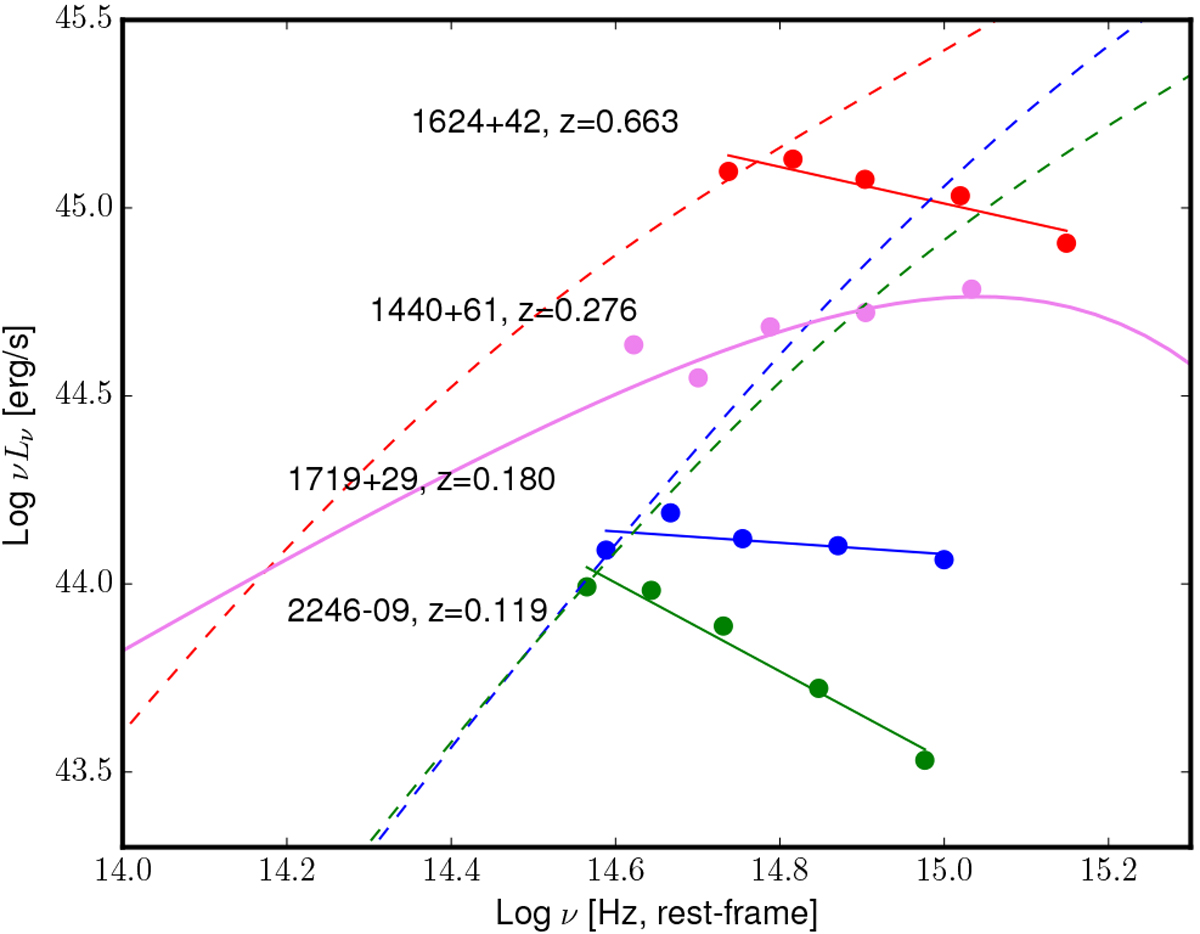
Optical SEDs for three RL-NLS1s and a RQ-NLS1. Green, red, and blue data show decreasing profiles of SDSS J 224605.44 − 091925.1 (z = 0.119), SDSS J162458.42 + 423107.5 (z = 0.663), and SDSS J171930.56 + 293412.8 (z = 0.180), typical of jet-dominated optical emissions. The analogous dashed lines show Shakura & Sunyaev (1973) disc profiles for the three sources, drawn with the virial masses by Järvelä et al. (2015) and normalized by forcing them to pass through the lowest frequency data point. Violet data, instead, show the disc-dominated profile of the RQ-NLS1 SDSS J144012.76 + 615633.2 (z = 0.276). The RL-NLS1s have an SED that is clearly not disc-like.
Current usage metrics show cumulative count of Article Views (full-text article views including HTML views, PDF and ePub downloads, according to the available data) and Abstracts Views on Vision4Press platform.
Data correspond to usage on the plateform after 2015. The current usage metrics is available 48-96 hours after online publication and is updated daily on week days.
Initial download of the metrics may take a while.