Fig. 1
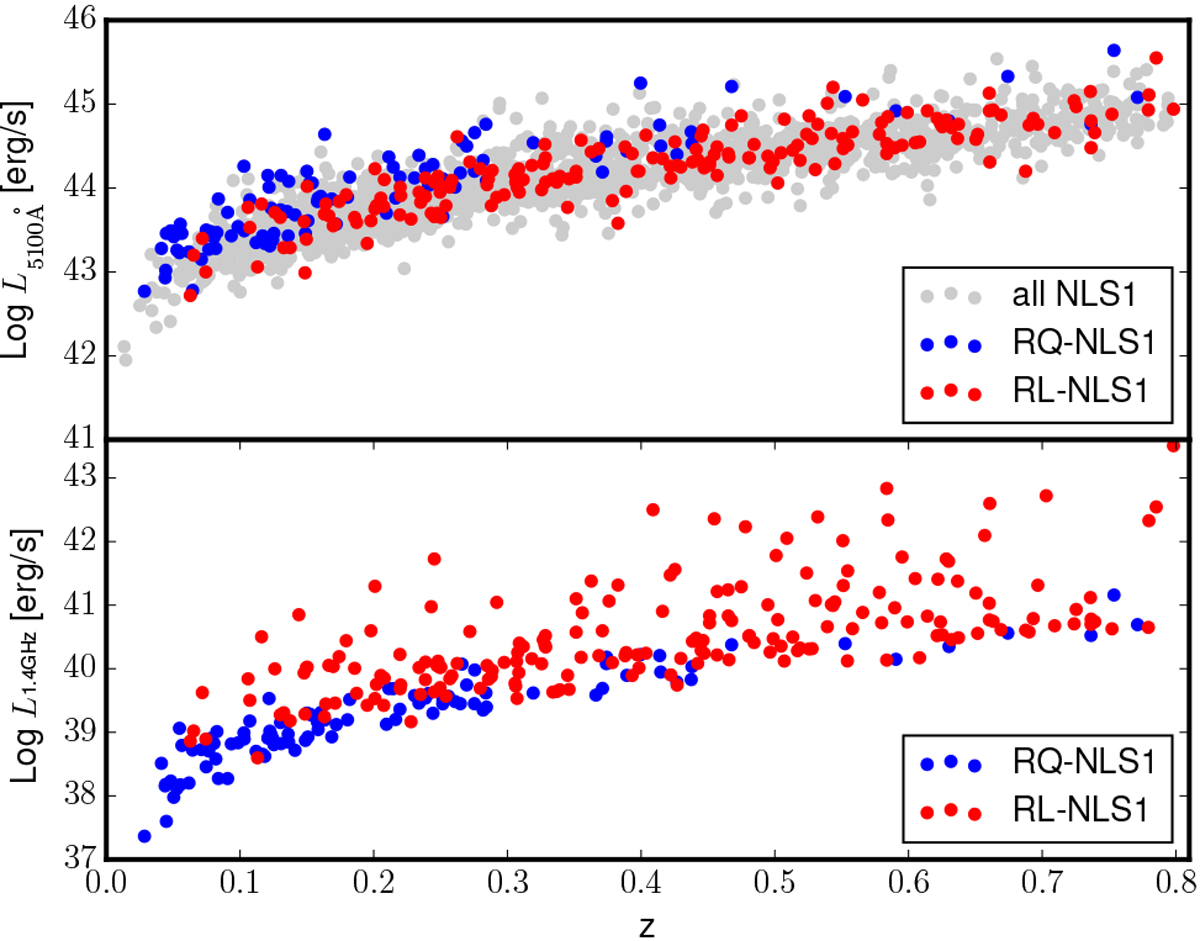
Distribution of 5100 Å (top panel) and radio (bottom panel) luminosities vs. redshift for the NLS1 subclasses. RQ-NLS1 (blue dots) are mainly located at low z. The few sources at higher z are among the most luminous: the radio flux sensitivity only allows us to observe the peak of the iceberg. RL-NLS1 (red dots), instead, are more evenly distributed in luminosities and z; thanks to their larger radio flux, they are less affected by this observational bias compared with RQ sources. They are missing in radio surveys from higher redshift than their RQ counterparts.
Current usage metrics show cumulative count of Article Views (full-text article views including HTML views, PDF and ePub downloads, according to the available data) and Abstracts Views on Vision4Press platform.
Data correspond to usage on the plateform after 2015. The current usage metrics is available 48-96 hours after online publication and is updated daily on week days.
Initial download of the metrics may take a while.