Fig. 9
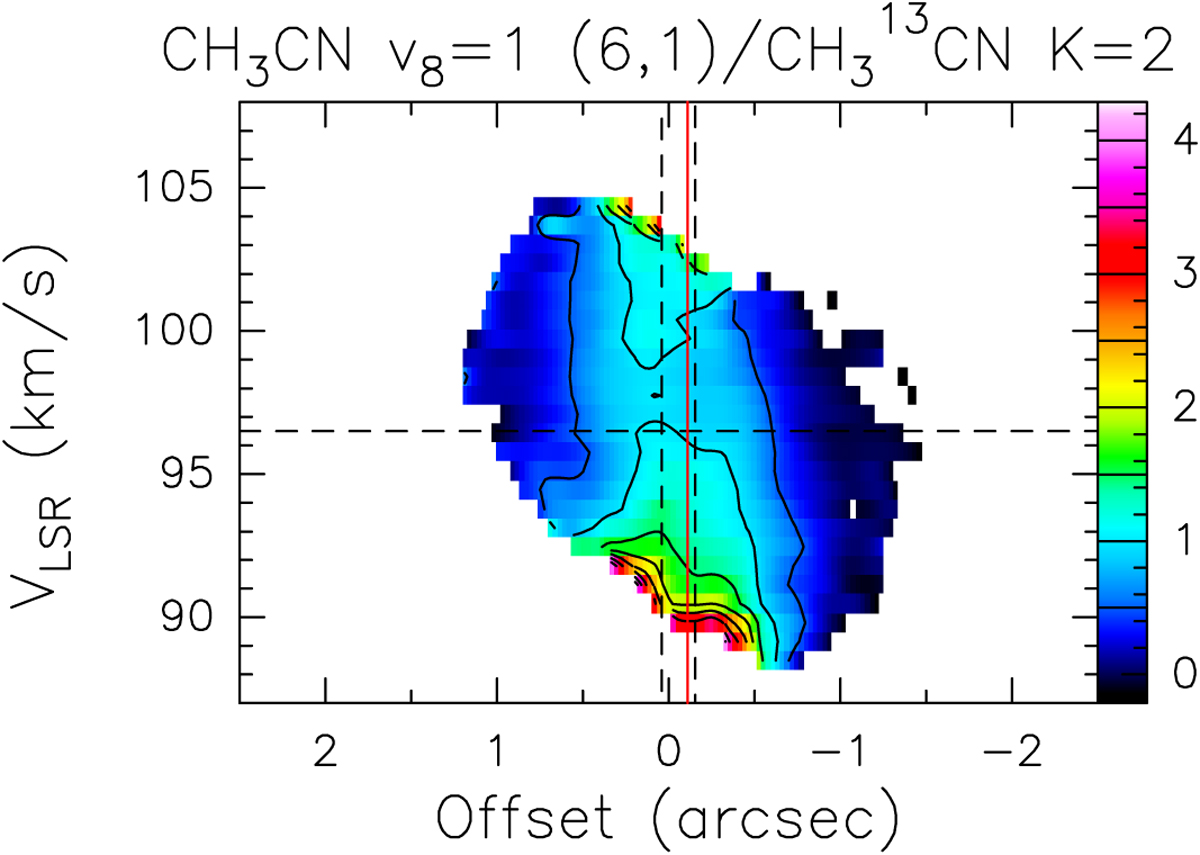
Position-velocity plot along the direction with PA = 68° of the CH3CN K, l = (6, 1) v8 = 1 (12–11) line divided by the same plot of the CH313CN K = 2 line. The offsets are measured from the phase center, positive to the northeast. Contour levels range from 0.5 to 4 in steps of 0.5. The vertical solid red line indicates the position of the continuum peak, while the vertical dashed black lines show the positions of the two compact free-free continuum sources detected by Cesaroni et al. (2010). The horizontal dashed line indicates the systemic LSR velocity of 96.5 km s−1.
Current usage metrics show cumulative count of Article Views (full-text article views including HTML views, PDF and ePub downloads, according to the available data) and Abstracts Views on Vision4Press platform.
Data correspond to usage on the plateform after 2015. The current usage metrics is available 48-96 hours after online publication and is updated daily on week days.
Initial download of the metrics may take a while.