Fig. 8
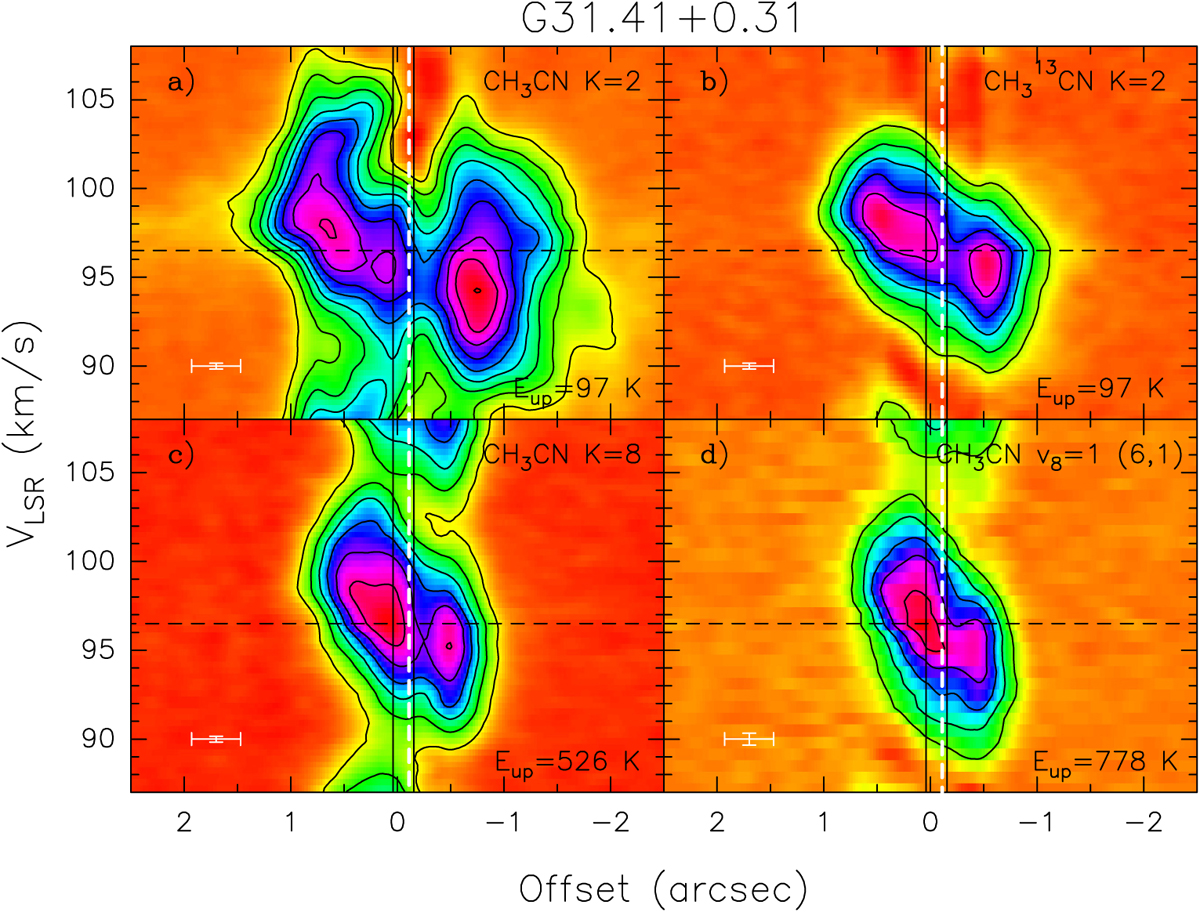
Position-velocity plots along the direction with PA = 68° toward the HMC of panel a: CH3CN K = 2, panel b: CH313CN K = 2, panel c: CH3CN K = 8, and panel d: CH3CN K, l = (6, 1) v8 = 1 (12–11). The offsets are measured from the phase center, positive to the northeast. Contour levels range from 20 to 180 mJy beam−1 in steps of 20mJy beam−1. The vertical dashed white line indicates the position of the continuum peak, while the vertical solid black lines show the position of the two compact free-free continuum sources detected by Cesaroni et al. (2010). The horizontal dashed line indicates the systemic LSR velocity. The error bars in the lower left-hand corner of the panels indicate the angular and spectral resolution of the data. The upper level energies Eup of each transition are indicated in the lower right-hand corner of the panels.
Current usage metrics show cumulative count of Article Views (full-text article views including HTML views, PDF and ePub downloads, according to the available data) and Abstracts Views on Vision4Press platform.
Data correspond to usage on the plateform after 2015. The current usage metrics is available 48-96 hours after online publication and is updated daily on week days.
Initial download of the metrics may take a while.