Fig. 6
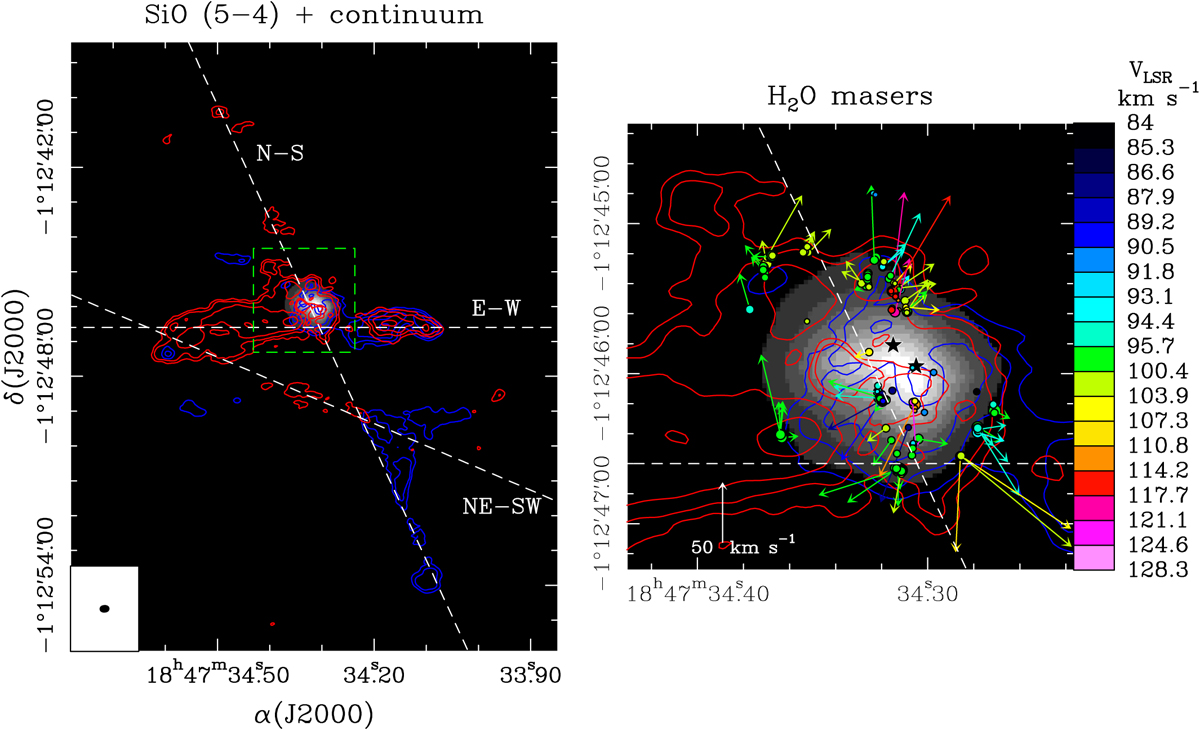
Left panel: same as Fig. 5. The white dashed lines indicate the direction of the threepossible outflows in G31, and the green dashed box indicates the area plotted in the close-up panel. Grayscale levels for the continuum are 10, 20, 30, 40, 50, 60, 60, 70, 80, and 90% of the peak. Right panel: close-up of the central region. Colored circles mark the position of H2 O masers while colored vectors indicate the direction and the amplitude of the proper motions (Moscadelli et al. 2013). The white vector in the bottom left corner indicates the amplitude scale of proper motions in kilometer per second. The black stars indicate the positions of the two free-free continuum sources detected by Cesaroni et al. (2010).
Current usage metrics show cumulative count of Article Views (full-text article views including HTML views, PDF and ePub downloads, according to the available data) and Abstracts Views on Vision4Press platform.
Data correspond to usage on the plateform after 2015. The current usage metrics is available 48-96 hours after online publication and is updated daily on week days.
Initial download of the metrics may take a while.