Fig. 5
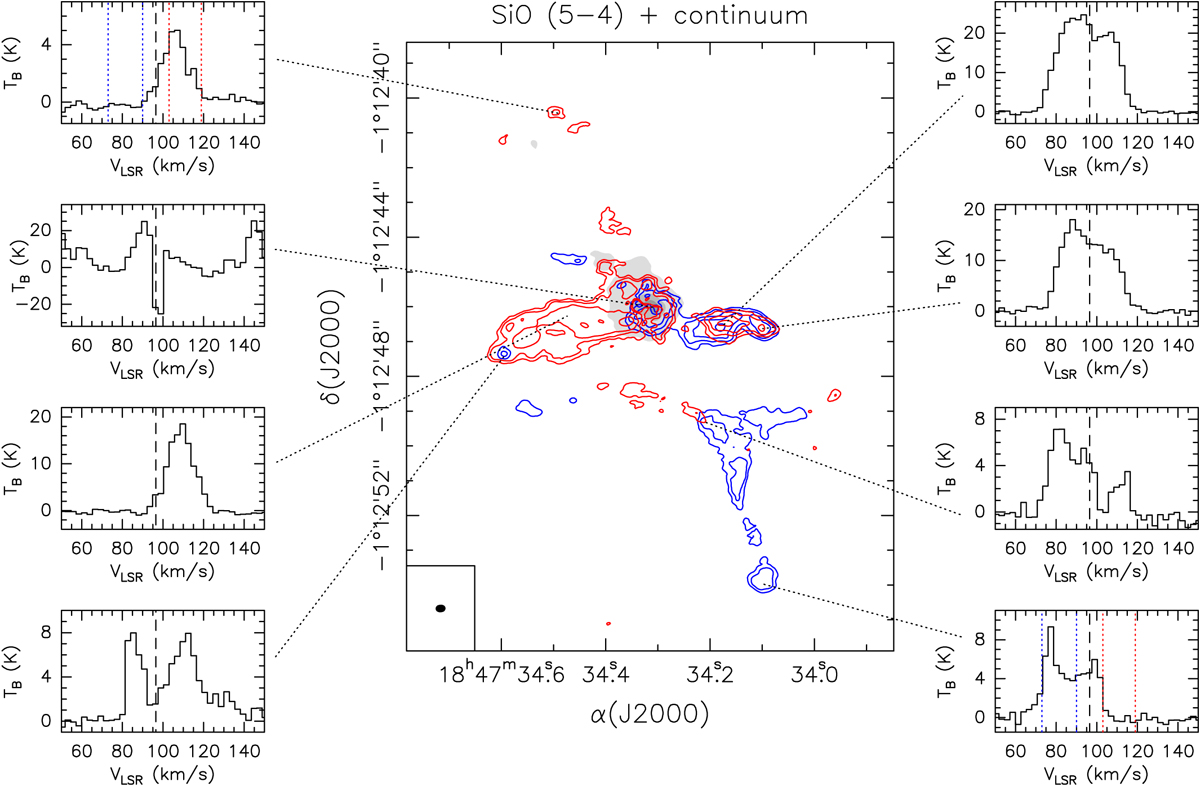
Middle panel: overlay of the 217 GHz continuum emission (grayscale) on the blue-shifted (blue contours) and red-shifted (red contours) SiO (5–4) averaged emission. The blue-shifted emission has been averaged over the (73, 90) km s−1 velocity interval and the red-shifted emission over the (103, 119) km s−1 one and are indicated in blue and red dotted vertical lines in the top left and lower right spectra. Contour levels are 3, 6, 12, and 24 times 1σ, where 1σ is 1.1 mJy beam−1. Grayscale contours for the continuum emission range from 7.5 to 232.5 mJy beam−1 in steps of 90mJy beam−1. The synthesized beam is shown in the lower left-hand corner. Left and right panels: SiO (5–4) spectra toward selected positions in the G31 core. The vertical dashed line indicates the systemic LSR velocity of 96.5 km s−1.
Current usage metrics show cumulative count of Article Views (full-text article views including HTML views, PDF and ePub downloads, according to the available data) and Abstracts Views on Vision4Press platform.
Data correspond to usage on the plateform after 2015. The current usage metrics is available 48-96 hours after online publication and is updated daily on week days.
Initial download of the metrics may take a while.