Fig. 3
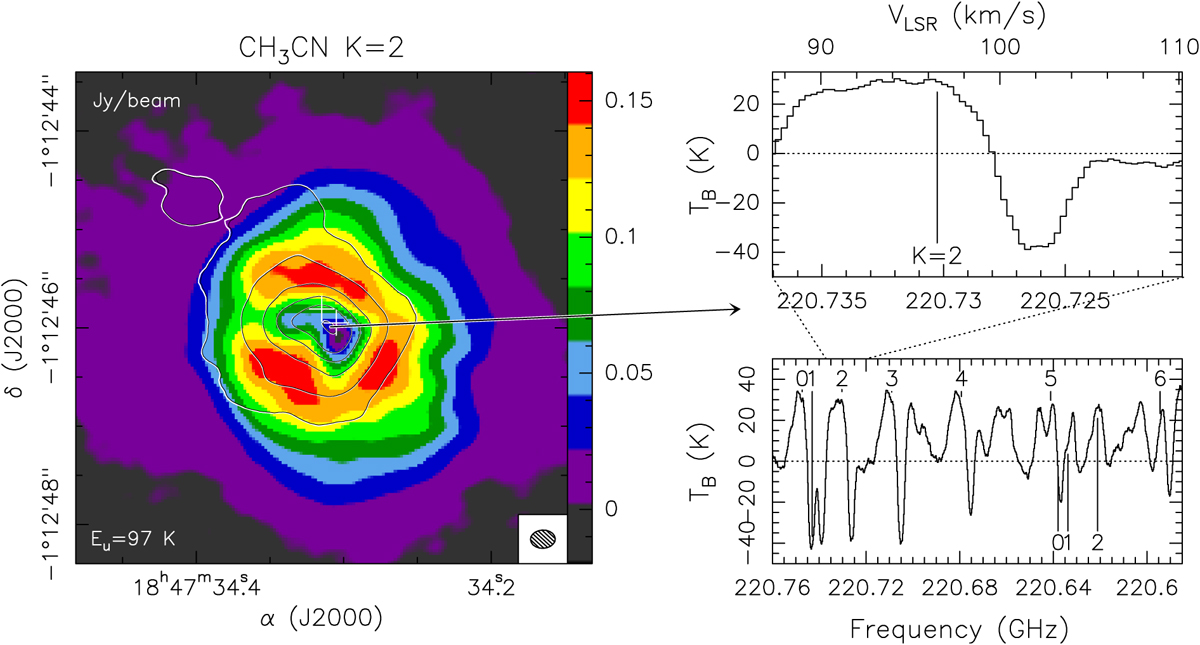
Left panel: dust continuum emission map (contours) overlaid on the map of the CH3 CN (12–11) K = 2 emissionaveraged over the velocity range 92 to 102 km s−1 (colors). Contours are 7.5, 30, 75, 120, 165, and 232.5 mJy beam−1. The white crosses indicate the positions of the two compact free-free continuum sources detected by Cesaroni et al. (2010). The synthesized beam is shown in the lower right-hand corner. Right panels: spectra of the CH3 CN K = 0 to 6 and CH313CN K = 0 to 2 toward the absorption dip, that is, toward the dust continuum peak. The upper right panel zooms in on the CH3 CN K = 2 spectrum.
Current usage metrics show cumulative count of Article Views (full-text article views including HTML views, PDF and ePub downloads, according to the available data) and Abstracts Views on Vision4Press platform.
Data correspond to usage on the plateform after 2015. The current usage metrics is available 48-96 hours after online publication and is updated daily on week days.
Initial download of the metrics may take a while.