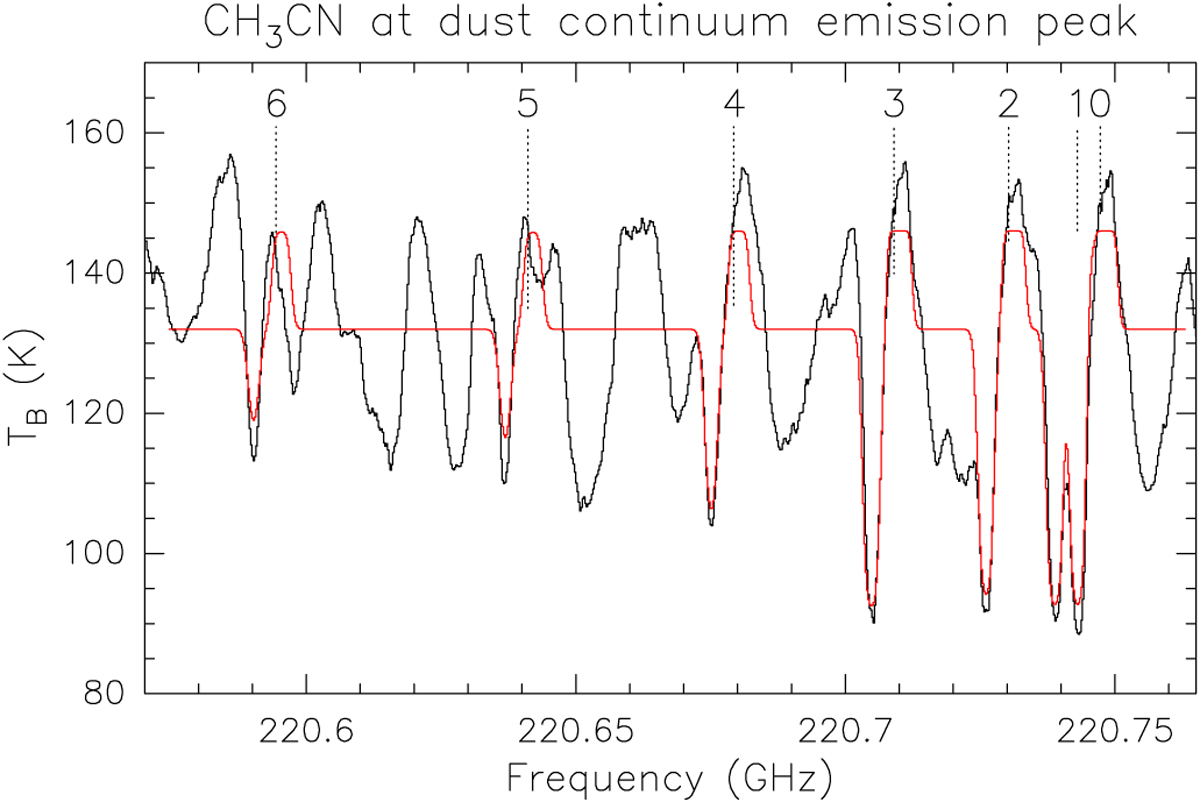
Fig. 12

Spectrum obtained at the dust continuum emission peak of the G31 Main core (black) and best fit to the CH3 CN (12–11) K = 0 to 6 transitions (red). The spectrum has been modeled with different components: i) a background layer with homogeneous intensity to describe the dust continuum core, ii) a core layer to describe the emission, and iii) a foreground layer located in front of the core component to describe the absorption (see Sect. 5.2.2). We note that the other emission and absorption lines not fitted correspond to other species.
Current usage metrics show cumulative count of Article Views (full-text article views including HTML views, PDF and ePub downloads, according to the available data) and Abstracts Views on Vision4Press platform.
Data correspond to usage on the plateform after 2015. The current usage metrics is available 48-96 hours after online publication and is updated daily on week days.
Initial download of the metrics may take a while.


