Fig. 11
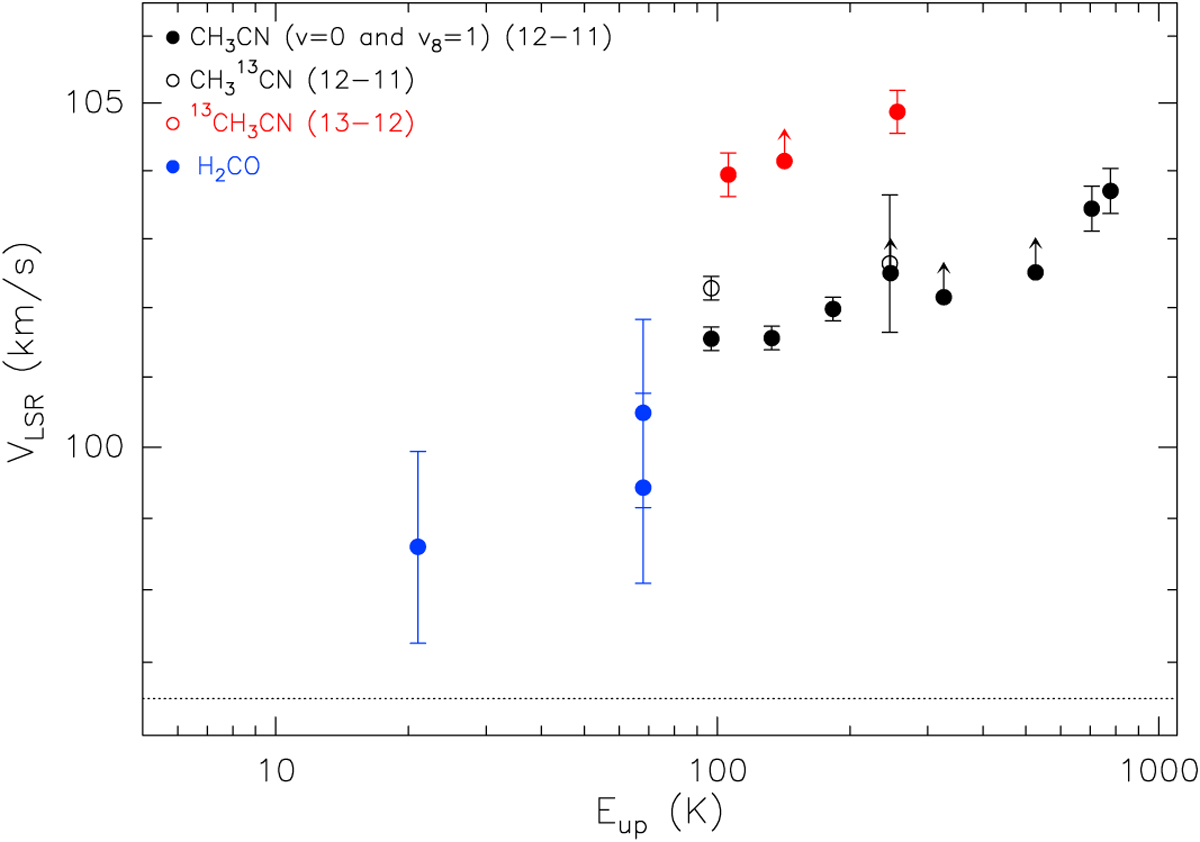
Velocity of the absorption feature (measured toward the dust continuum peak) versus the upper level energy of the corresponding CH3CN, CH313CN, and 13CH3CN, and H2 CO transitions. The systemic LSR velocity is 96.5 km s−1 and is indicated with a dotted line. The black arrows indicate lower limits to the velocity and are for those lines that are slightly blended with other lines at frequencies lower than their rest frequency.
Current usage metrics show cumulative count of Article Views (full-text article views including HTML views, PDF and ePub downloads, according to the available data) and Abstracts Views on Vision4Press platform.
Data correspond to usage on the plateform after 2015. The current usage metrics is available 48-96 hours after online publication and is updated daily on week days.
Initial download of the metrics may take a while.