Fig. 10
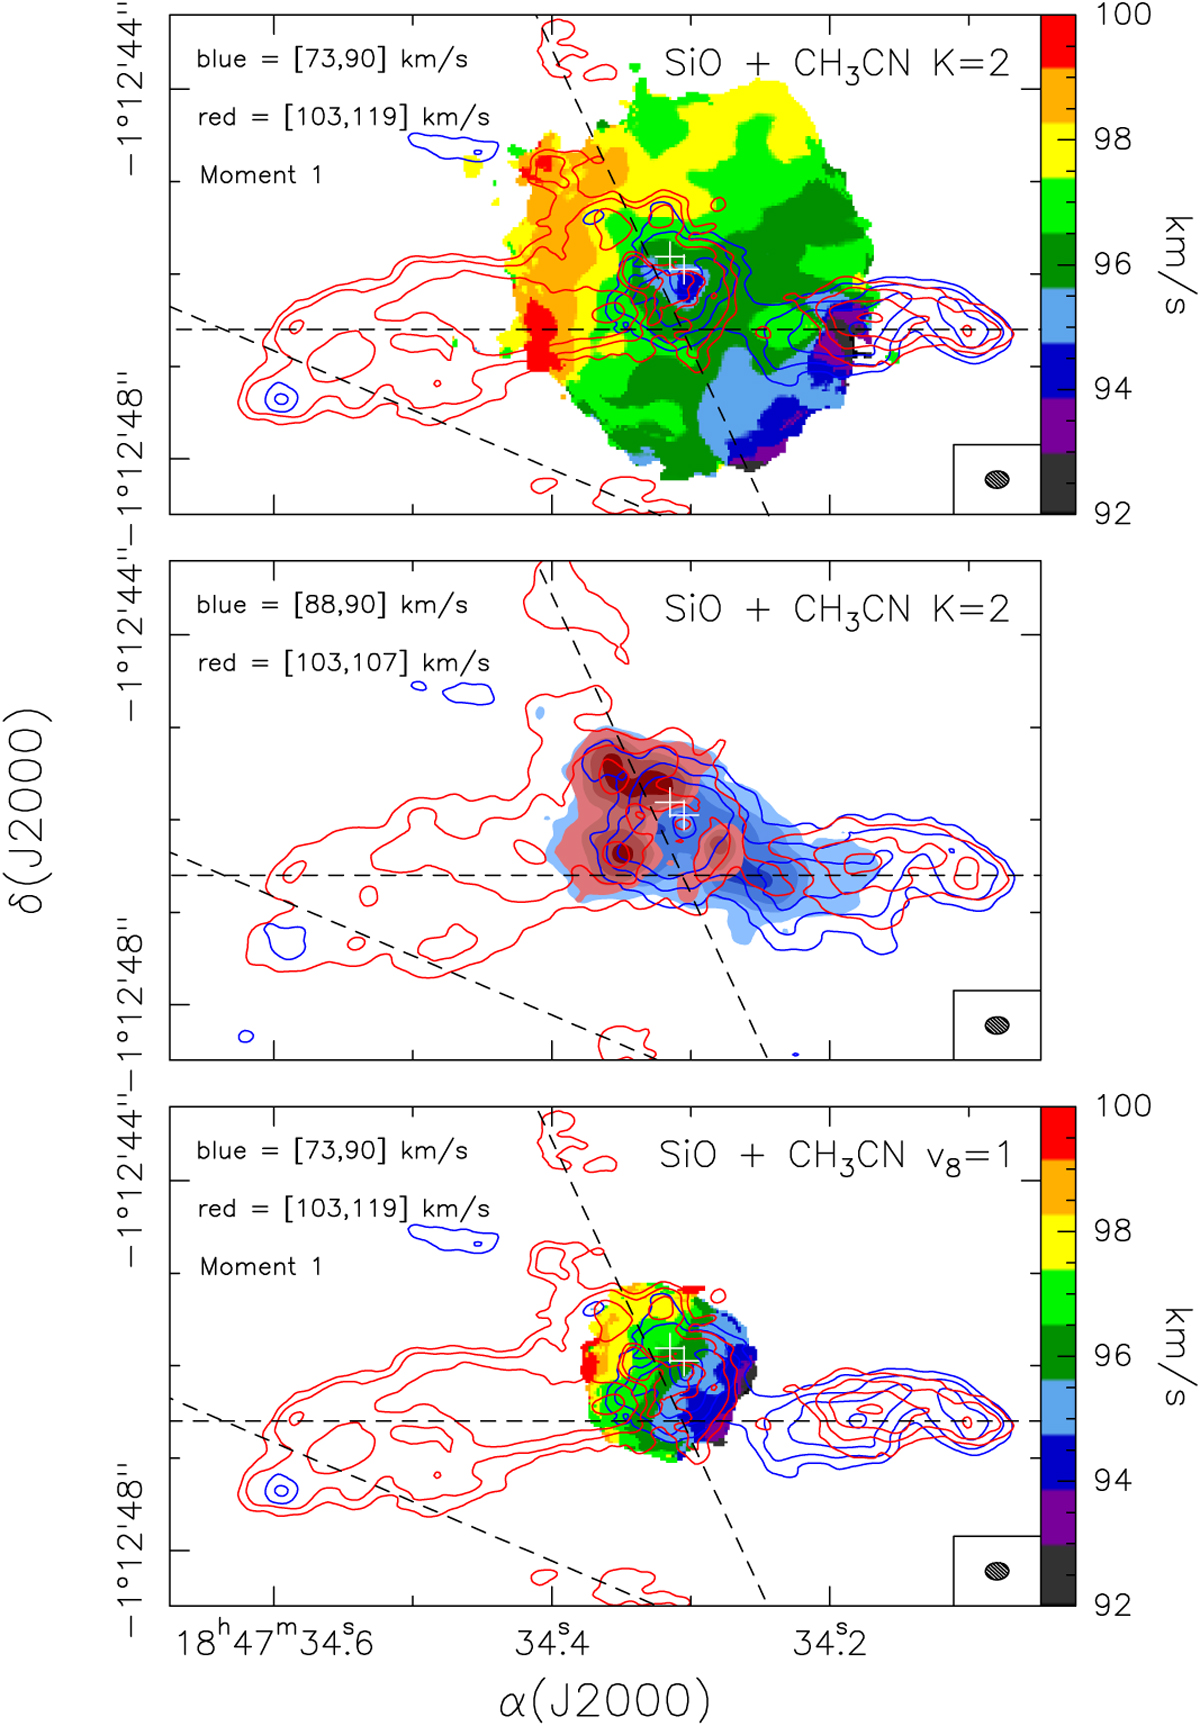
Top panel: overlay of the line velocity (moment 1) map of CH3CN K = 2 (12–11) (colors) on the SiO (5–4) blue-shifted (blue contours) and red-shifted (red contours) averaged emission. The CH3CN K = 2 line velocity map has been computed over the velocity range (92, 100) km s−1. The velocity intervals over which the SiO emission has been averaged are indicated in the upper left-hand corner. Contour levels are the same as in Fig. 5. Middle panel: overlay of the CH3 CN K = 2 (12–11) and SiO (5–4) blue-shifted and red-shifted emission averaged over the same velocity intervals, which are indicated in the upper left-hand corner. Contour and grayscale levels are 6, 18, 36, and 72 mJy beam−1. Bottom panel: same as the top panel but for CH3CN K, l = (6, −1) v8 = 1 (12–11). The synthesized beam is shown in the lower right-hand corner. The white crosses indicate the positions of the two compact free-free continuum sources detected by Cesaroni et al. (2010). The black dashed lines indicate the direction of the three possible outflows.
Current usage metrics show cumulative count of Article Views (full-text article views including HTML views, PDF and ePub downloads, according to the available data) and Abstracts Views on Vision4Press platform.
Data correspond to usage on the plateform after 2015. The current usage metrics is available 48-96 hours after online publication and is updated daily on week days.
Initial download of the metrics may take a while.