Fig. 5
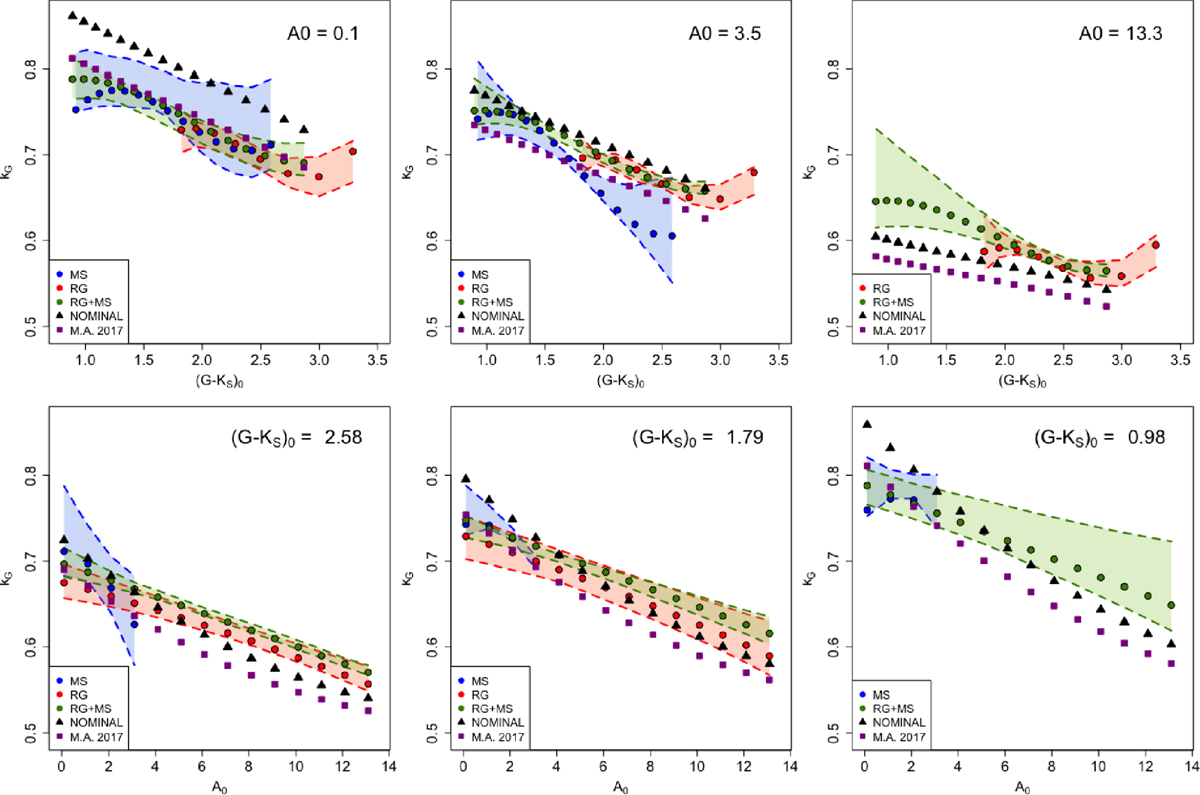
Directcomparison of the empirical extinction coefficient kG as a functionof (G − KS)0 for A0 = 0.1, 3.5, 13.3 mag (top panels) and A0 for (G − KS)0 = 2.58, 1.79, 0.98 (bottom panels, which corresponds to Teff = 4020, 5080, 6500 K). A0 = 3.5, 13.3 mag are the limit values for the MS and RG samples, respectively (see Table 3) while (G − KS)0 = 2.58, 1.79 are the maximal colour of LAMOST and the minimal colour of APOGEE, respectively. (G − KS)0 = 0.98 is a sample case to show the behaviour at low colour indexes (i.e. high temperatures). Dots show the kG mean value while the shaded area shows the 95% interval of confidence (see Sect. 5). Colours correspond to the red giants (RG, red), the main sequence (MS, blue) and unified sample (RG + MS, green). Black triangles and magenta squares show the theoretical kG coefficient computed with the Gaia pre-launch (NOMINAL, Jordi et al. 2010) and Gaia G-DR1 (M.A. 2017, Maíz Apellániz 2017) passbands, respectively.
Current usage metrics show cumulative count of Article Views (full-text article views including HTML views, PDF and ePub downloads, according to the available data) and Abstracts Views on Vision4Press platform.
Data correspond to usage on the plateform after 2015. The current usage metrics is available 48-96 hours after online publication and is updated daily on week days.
Initial download of the metrics may take a while.