Fig. 4
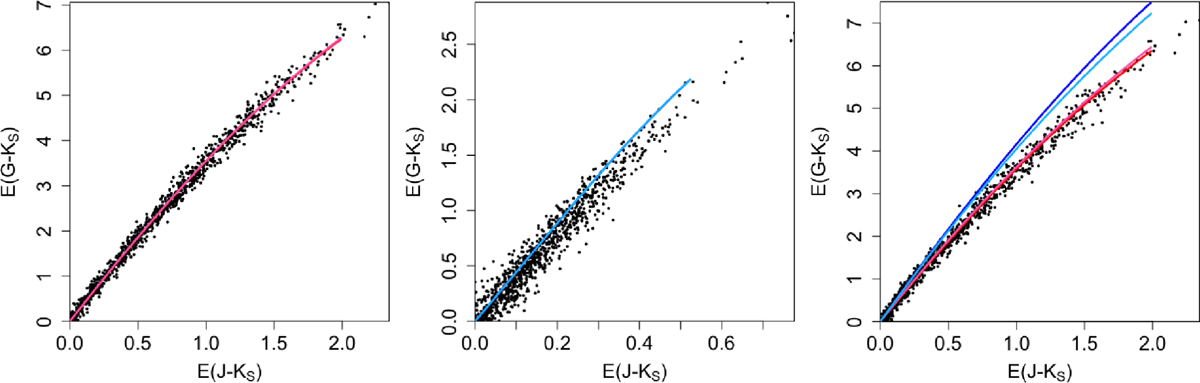
Colour excesses E(G − KS) versus E(J − KS) for the red giants sample (left), the main sequence sample (center) and the combined sample (right). Black dots are the 1000 stars selected in each sample. Solid lines represent the colour excess increase with extinction for a reference temperature Teff (4136 Kfor RG, red; 5550 K for MS, dark blue) and the corresponding reference colour ![]() (2.49 for RG, pink; 1.49 for MS, light blue). We note that some lines may overlap. Their cut corresponds to the interval of absorption A0 indicated in Table 3 (13.3 for RG, 3.5 for MS).
(2.49 for RG, pink; 1.49 for MS, light blue). We note that some lines may overlap. Their cut corresponds to the interval of absorption A0 indicated in Table 3 (13.3 for RG, 3.5 for MS).
Current usage metrics show cumulative count of Article Views (full-text article views including HTML views, PDF and ePub downloads, according to the available data) and Abstracts Views on Vision4Press platform.
Data correspond to usage on the plateform after 2015. The current usage metrics is available 48-96 hours after online publication and is updated daily on week days.
Initial download of the metrics may take a while.