Fig. 1
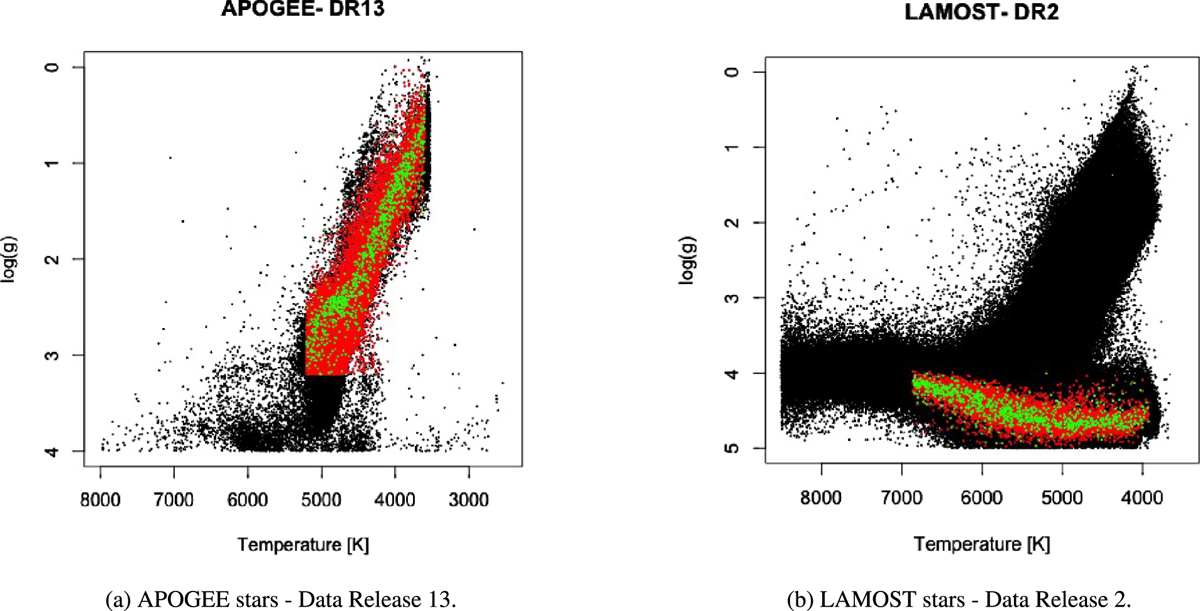
Data selection: spectroscopic surveys used for the red giants (APOGEE stars – data release 13, left) and the main sequence (LAMOST stars – data release 2, right) analysis. Black points represent stars in each data release, red points are objects in the first sample selection, used to differentiate red giant stars from dwarfs and vice versa. Green points represent a 1000 star sample selection we used to measure the extinction coefficient.
Current usage metrics show cumulative count of Article Views (full-text article views including HTML views, PDF and ePub downloads, according to the available data) and Abstracts Views on Vision4Press platform.
Data correspond to usage on the plateform after 2015. The current usage metrics is available 48-96 hours after online publication and is updated daily on week days.
Initial download of the metrics may take a while.