Fig. 6
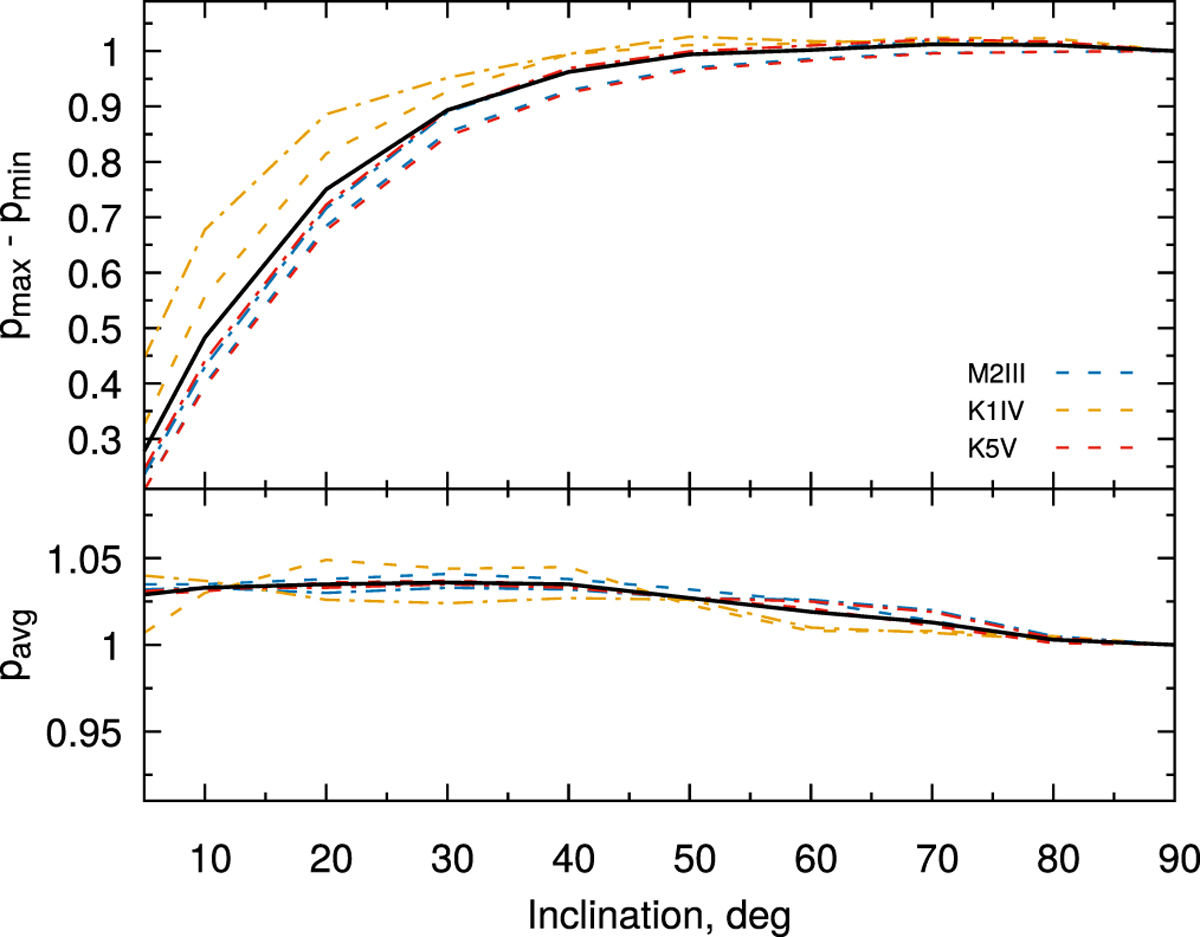
Polarization degree amplitude (top) and average (bottom) values per rotation period for different axis inclination angles at λ = 4450, (normalized to 90°). Models are the same as in Fig. 4. For each model, different spot coverages were tested, using two scalings for σA with nσ, equal to 0.5 (dash-dotted line) and 1.0 (dashed line). The average curve from all simulations is shown as the black solid line.
Current usage metrics show cumulative count of Article Views (full-text article views including HTML views, PDF and ePub downloads, according to the available data) and Abstracts Views on Vision4Press platform.
Data correspond to usage on the plateform after 2015. The current usage metrics is available 48-96 hours after online publication and is updated daily on week days.
Initial download of the metrics may take a while.