Free Access
Fig. 3
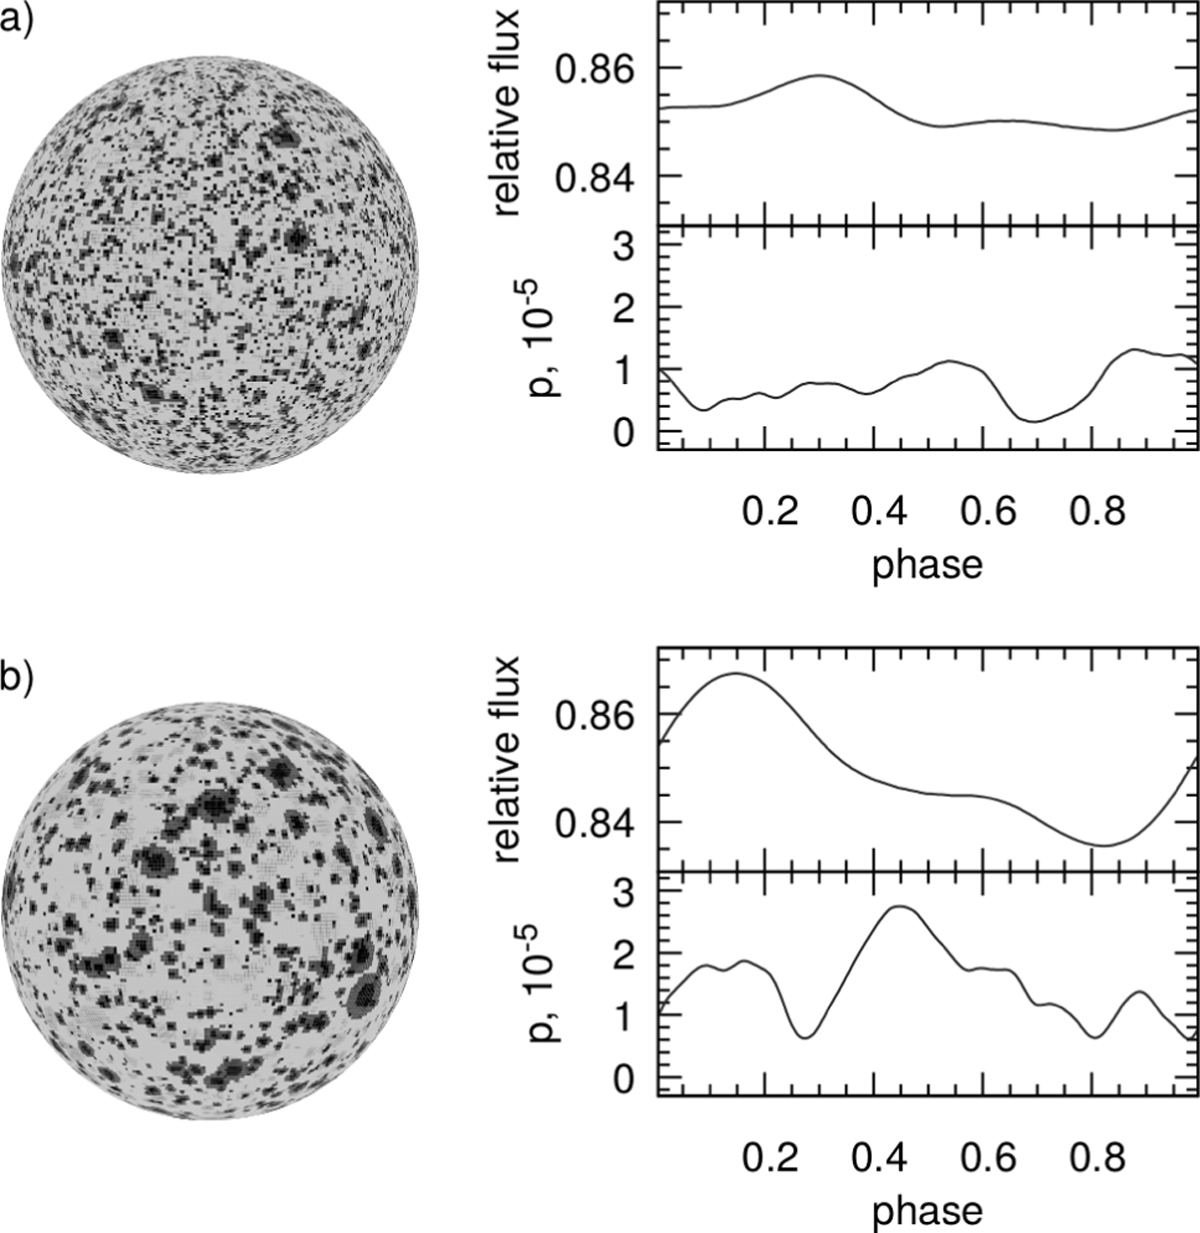
Relative flux and polarization degree phase curves for a model M2IV star with Teff = 3500 K, Tspot = 3000 K, and log g = 3.0 at λ = 4450 Å for one total spot coverage of 30%, but different average spot sizes ⟨A⟩ (1.63 and 9.38 [ × 10−6A1∕2*]), calculated using nA = 0.5 (top) and 1.0 (bottom).
Current usage metrics show cumulative count of Article Views (full-text article views including HTML views, PDF and ePub downloads, according to the available data) and Abstracts Views on Vision4Press platform.
Data correspond to usage on the plateform after 2015. The current usage metrics is available 48-96 hours after online publication and is updated daily on week days.
Initial download of the metrics may take a while.