Free Access
Fig. 3
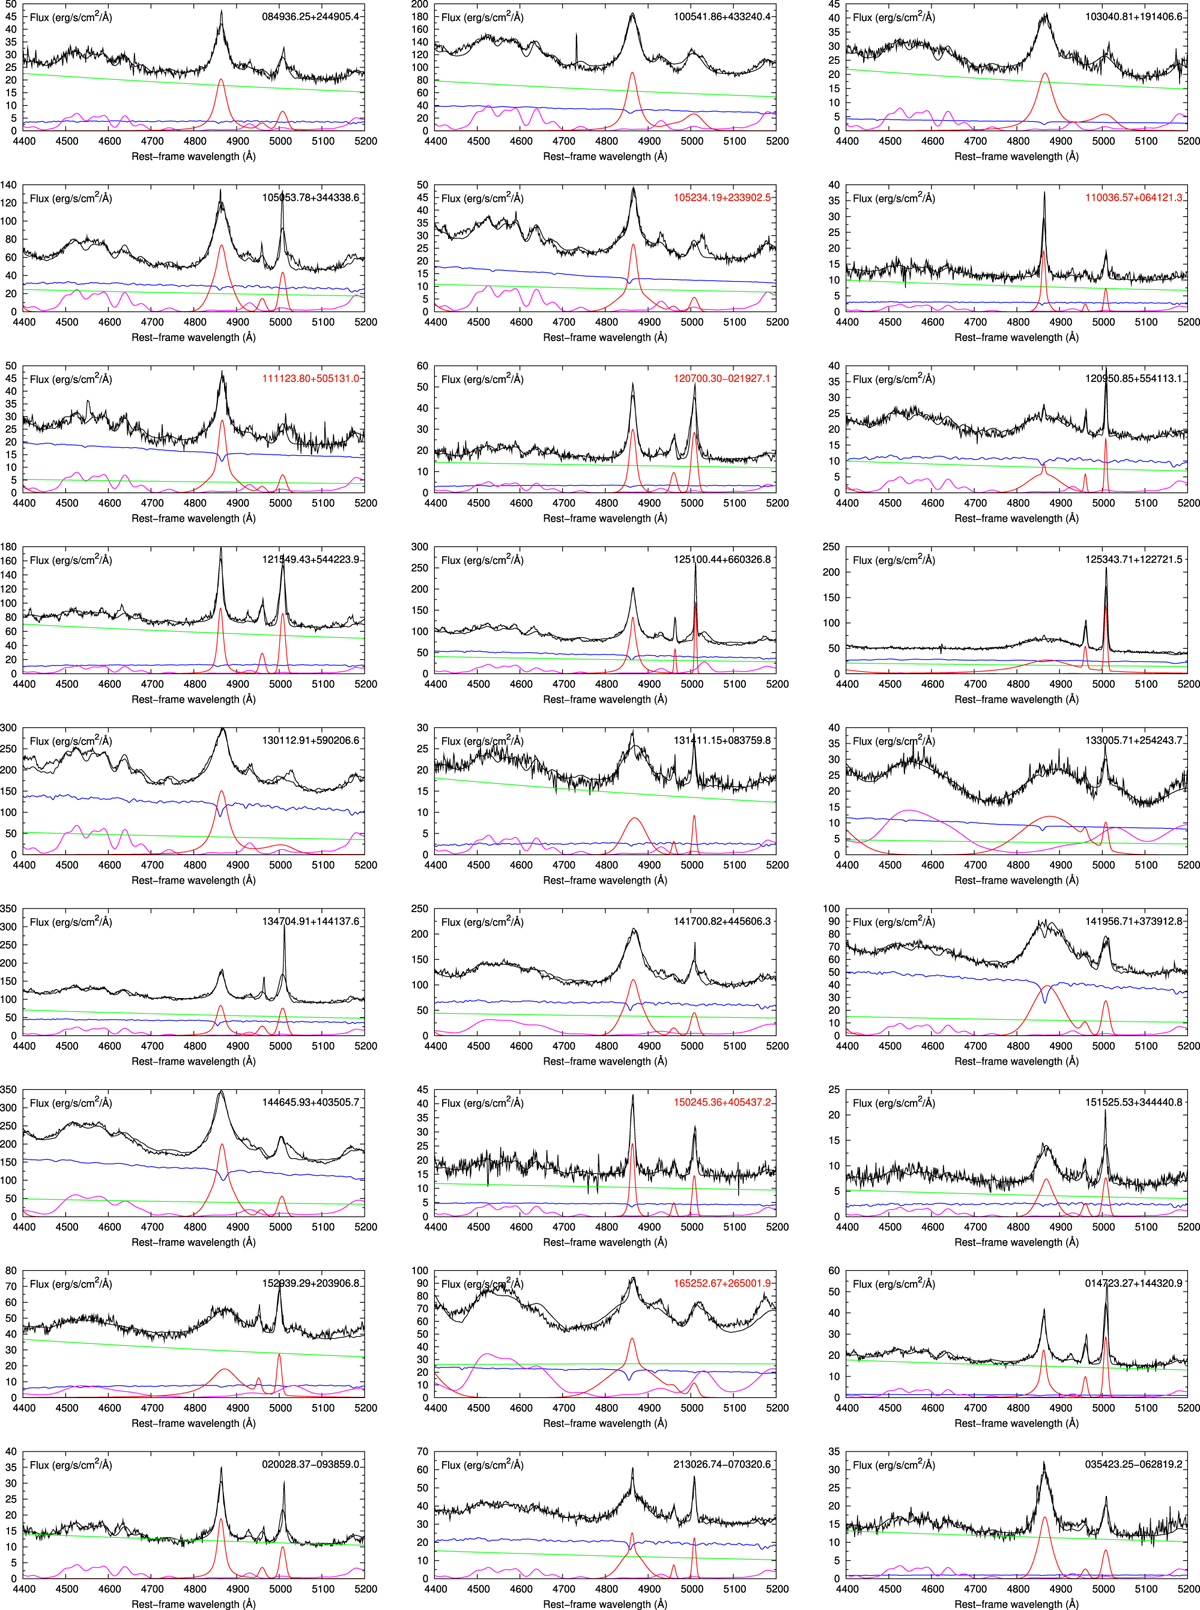
Region of the Hβ line forall sources, with a black line showing the data and the best fit. The fit components are given in the following colors: emission lines (red), Fe II (magenta), disk power law including extinction (green), and starlight (blue). Objects with extreme values of RFe after refitting have red labels.
Current usage metrics show cumulative count of Article Views (full-text article views including HTML views, PDF and ePub downloads, according to the available data) and Abstracts Views on Vision4Press platform.
Data correspond to usage on the plateform after 2015. The current usage metrics is available 48-96 hours after online publication and is updated daily on week days.
Initial download of the metrics may take a while.