Fig. 8
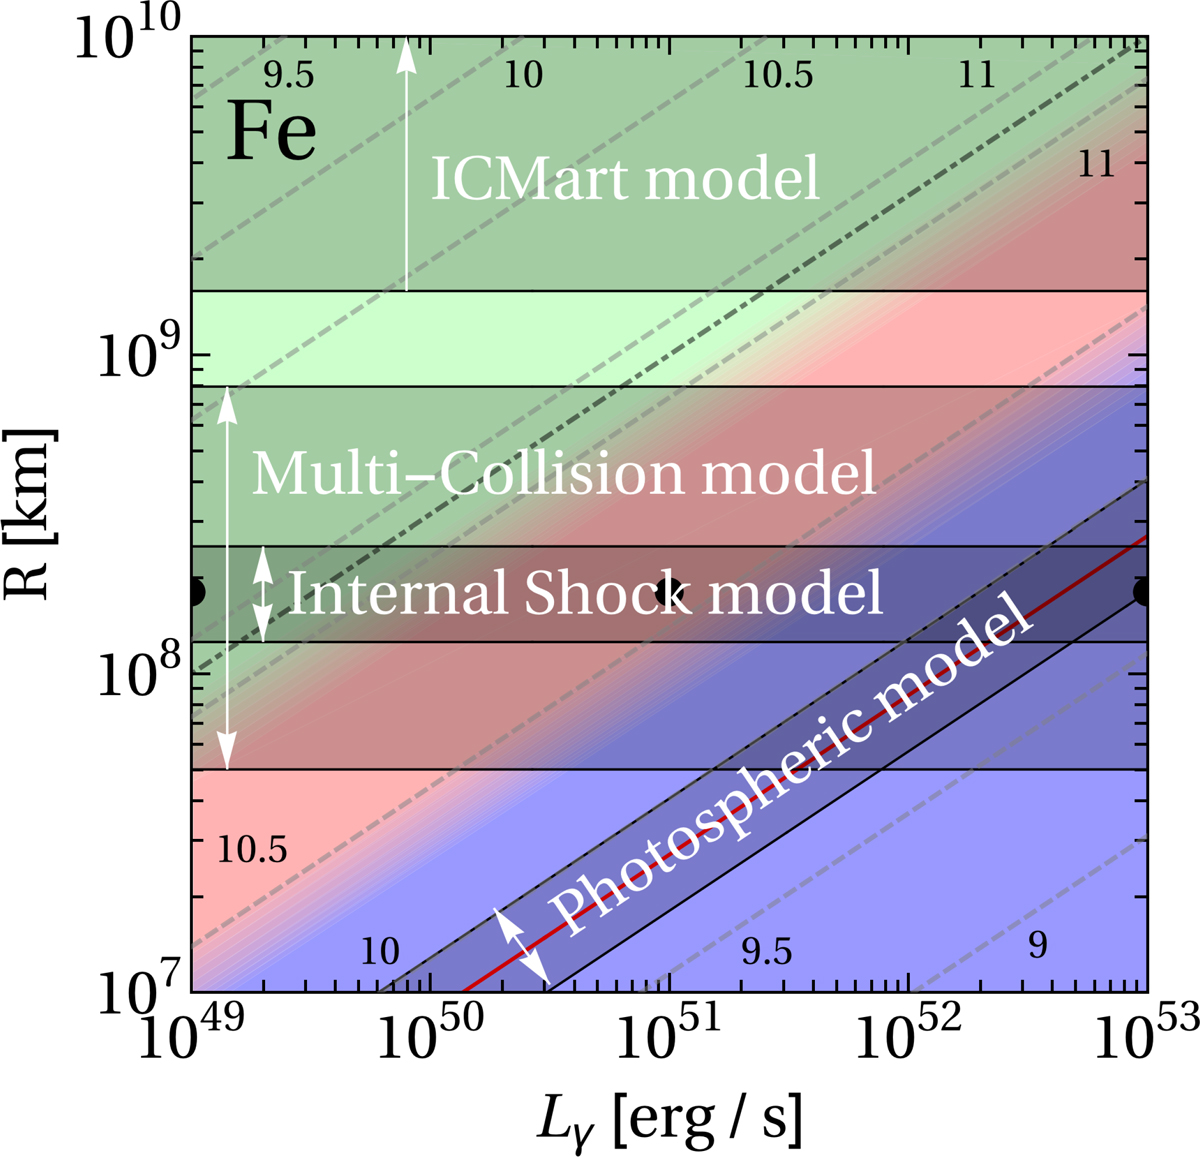
Impact of different astrophysical model assumptions (see marked shadings) for fixed tv = 0.01 s. Similar to Fig. 7 for 56Fe, but the internal shock model relationship Eq. (8) among collision radius, tv , and Γ is not applied, and only holds in the region marked “Internal Shock model”, which implies that for the prototypes (circles) the same results as in Sect. 3 are obtained. Here the idea is that R is the main control parameter for the target density in the shells, whereas tv determines the shell thickness and Γ the energy shift only, that is, the dependence on these parameters is milder (the pion production efficiency scales ∝ tv similar to Lγ, but typically does not vary in such a large range; therefore Lγ is chosen as parameter here); further details are given in Sect. 2.5. The regions applying to different astrophysical production models (taken from Zhang & Kumar 2013, for multi-collision model see Sect. 2.5) are sketched in the figure for the chosen value of tv (fast time variability in light curve). We note that the maximal energies are shown as gray dashed curves as in Fig. 7, but not the transition curves among the cascade regions. Instead, the dashed-dotted line separates the Aγ dominated (lower right corner) and adiabatic-loss-dominated (upper left corner) maximal primary energy regions.
Current usage metrics show cumulative count of Article Views (full-text article views including HTML views, PDF and ePub downloads, according to the available data) and Abstracts Views on Vision4Press platform.
Data correspond to usage on the plateform after 2015. The current usage metrics is available 48-96 hours after online publication and is updated daily on week days.
Initial download of the metrics may take a while.