Fig. 14
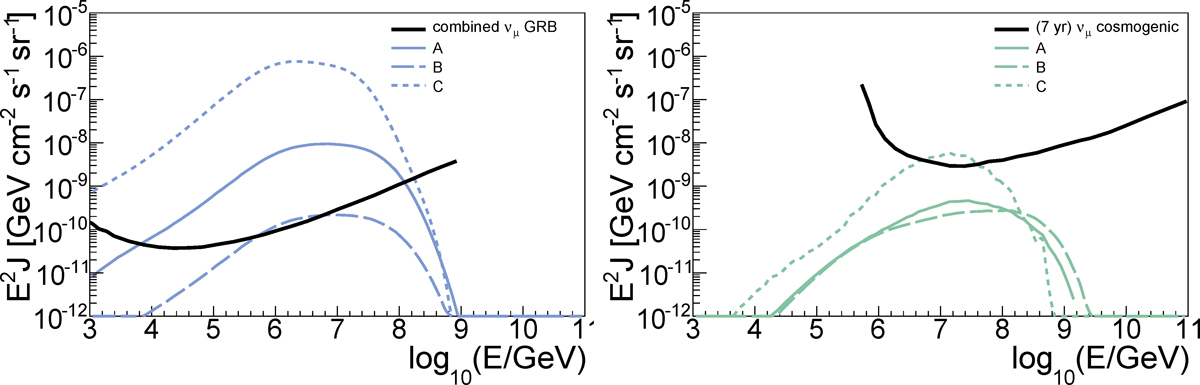
Prompt and cosmogenic (muon flavor) neutrino spectra obtained for selected points in the parameter space in Fig. 11 for the Mixed Composition Dip model. Here we compare to the differential limits obtained from Aartsen et al. (2017, considering northern + southern exposure) and Aartsen et al. (2016). The different points are: A: (log10(R∕km), log10(Lγ∕(erg s−1))) = (8.1, 50.5), B: (8.1, 49.5), C: (8.1, 51.7). Here the differential limits are defined as in Baerwald et al. (2015), such that following the differential limit curve for one decade in energy will yield one event.
Current usage metrics show cumulative count of Article Views (full-text article views including HTML views, PDF and ePub downloads, according to the available data) and Abstracts Views on Vision4Press platform.
Data correspond to usage on the plateform after 2015. The current usage metrics is available 48-96 hours after online publication and is updated daily on week days.
Initial download of the metrics may take a while.