Fig. 3
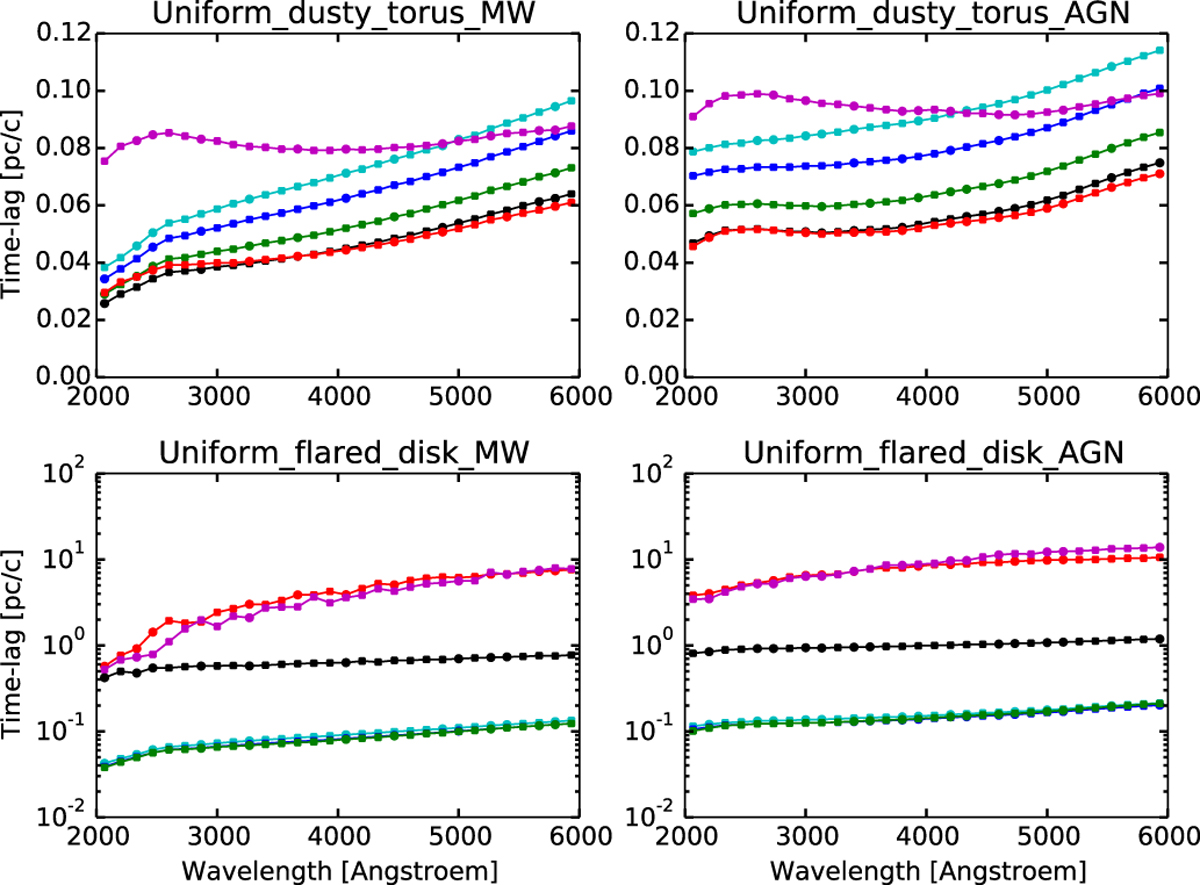
Comparison of the time lags induced by the Milky Way and by AGN dust prescription for the case of a uniform dusty torus and a uniform flared disk. The plots showthe time lag as a function of wavelength for different viewing angles: the magenta dots denote θ = 79.9∘ , and the red dots θ = 71.0∘ , which represents a type 2 view. The black dots show θ = 61.64∘ , a view close to the torus horizon. Type 1 views are shown in green (θ = 51.3∘ ), blue (θ = 39.19∘ ), and cyan (θ = 28.9∘).
Current usage metrics show cumulative count of Article Views (full-text article views including HTML views, PDF and ePub downloads, according to the available data) and Abstracts Views on Vision4Press platform.
Data correspond to usage on the plateform after 2015. The current usage metrics is available 48-96 hours after online publication and is updated daily on week days.
Initial download of the metrics may take a while.