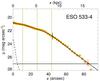
Fig. 9
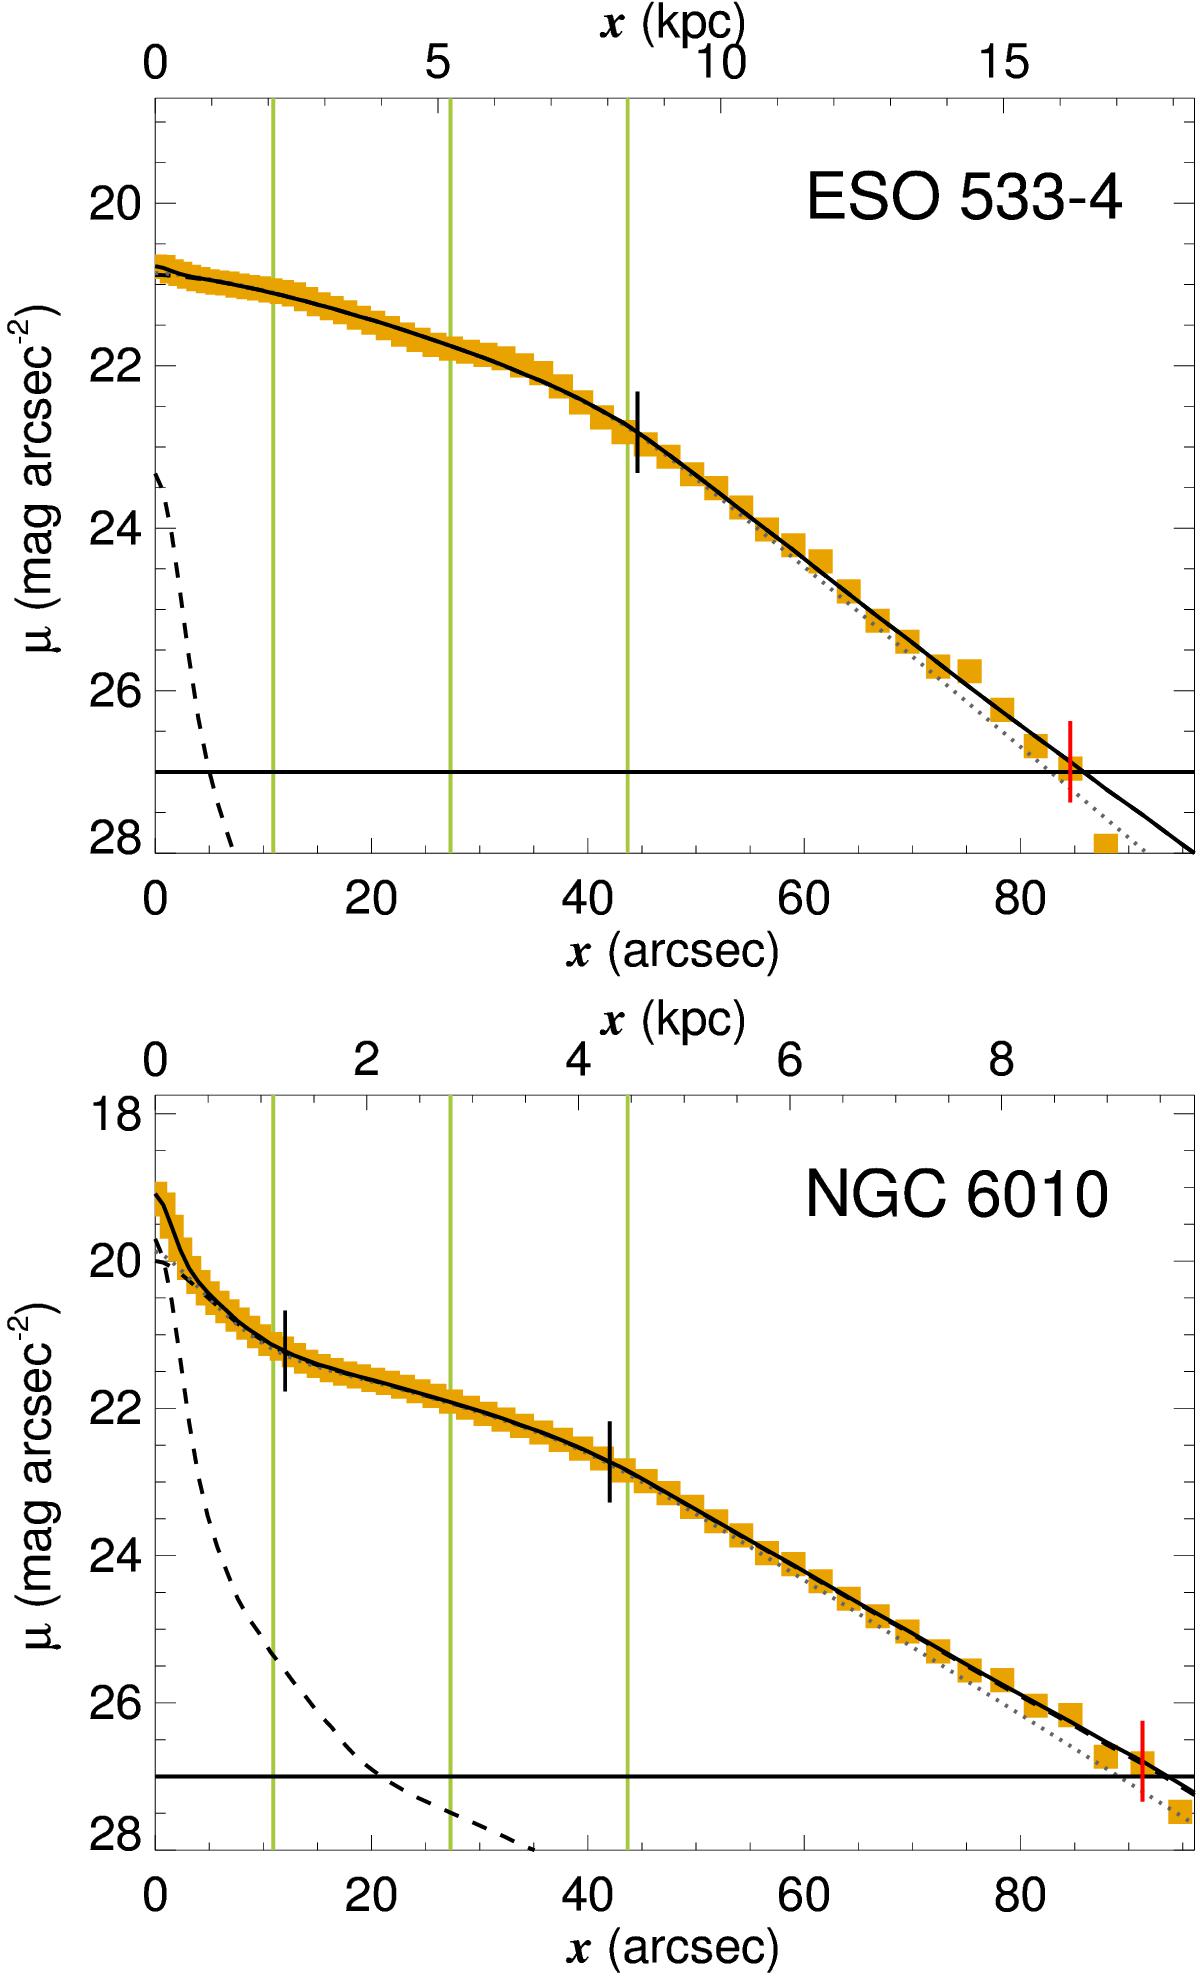
Axial surface-brightness profiles (yellow symbols) and fits (continuous black curve) for ESO 533-4 (top) and NGC 6010 (bottom). The fitted disc and CMC contributions are indicated with dashed lines. The small vertical black lines indicate the break radii. The red vertical lines indicate the outermost fitted point. The vertical green lines indicate the axial extent of the 0.2 r25< |x| < 0.5 r25 and 0.5 r25< |x| < 0.8 r25 vertical surface-brightness profiles. The horizontal lines indicate the μ = 27 mag arcsec-2 level. The grey dotted curves indicate the unconvolved disc fitted model.
Current usage metrics show cumulative count of Article Views (full-text article views including HTML views, PDF and ePub downloads, according to the available data) and Abstracts Views on Vision4Press platform.
Data correspond to usage on the plateform after 2015. The current usage metrics is available 48-96 hours after online publication and is updated daily on week days.
Initial download of the metrics may take a while.