Fig. 3
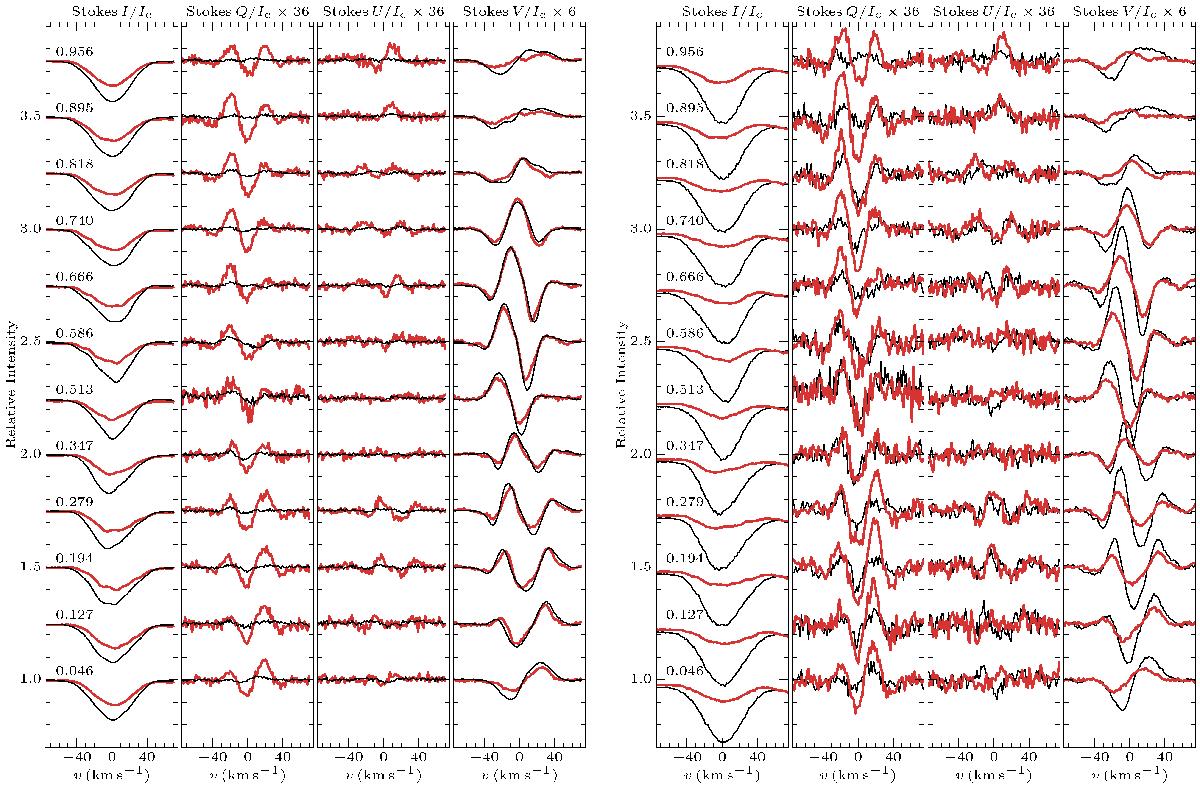
Mean Stokes IQUV line profiles of HD 119419. The LSD Stokes profiles are shown in the left panel. The profiles of Fe-peak elements are shown with thin black lines, while the LSD profiles of REEs are plotted with thick red lines. The Stokes profiles computed by simple averaging of unblended lines are shown in the right panel. Profiles obtained by averaging Nd iii lines are shown with thick red lines, while profiles obtained by averaging Fe ii, Cr ii, and Ti ii lines are illustrated with thin black curves. The spectra are shifted vertically and are ordered according to the rotational phases indicated in the Stokes I sub-panel of each plot.
Current usage metrics show cumulative count of Article Views (full-text article views including HTML views, PDF and ePub downloads, according to the available data) and Abstracts Views on Vision4Press platform.
Data correspond to usage on the plateform after 2015. The current usage metrics is available 48-96 hours after online publication and is updated daily on week days.
Initial download of the metrics may take a while.