Fig. 9
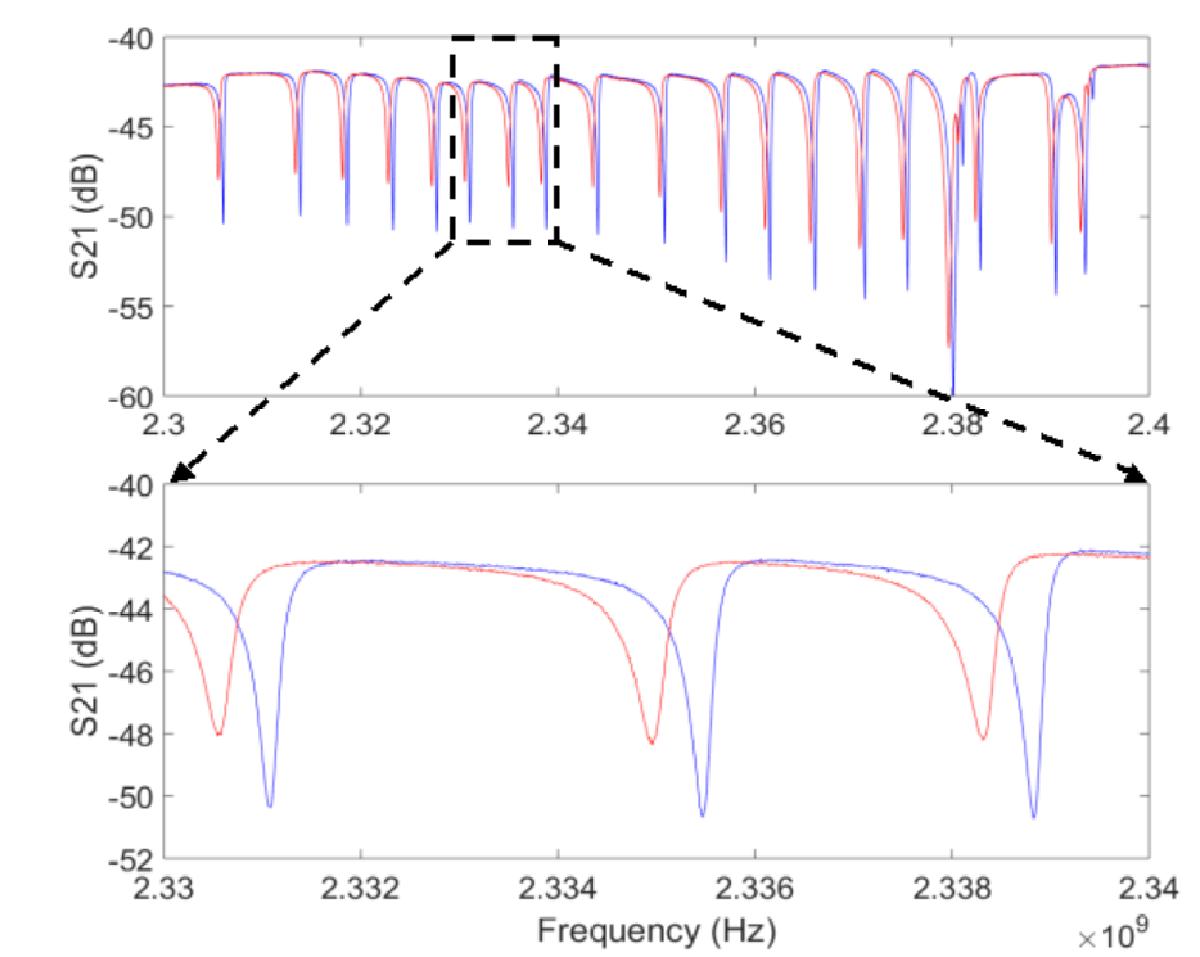
Responsivity estimation using the sky simulator. Top panel: frequency sweep of a portion of one particular feedline operating at 260 GHz. Bottom panel: zoom on three typical resonances. In both panels we plot the S21 transmission parameter (dB) against the frequency. Blue lines: cold sky simulator (TSS ~ 80 K). Red lines: 300 K background. The measured average responsivity, that is, the shift in frequency per unit temperature background variation, is around 2 kHz/K for the 260 GHz arrays and 1 kHz/K in the case of the 150 GHz array.
Current usage metrics show cumulative count of Article Views (full-text article views including HTML views, PDF and ePub downloads, according to the available data) and Abstracts Views on Vision4Press platform.
Data correspond to usage on the plateform after 2015. The current usage metrics is available 48-96 hours after online publication and is updated daily on week days.
Initial download of the metrics may take a while.