Fig. 8
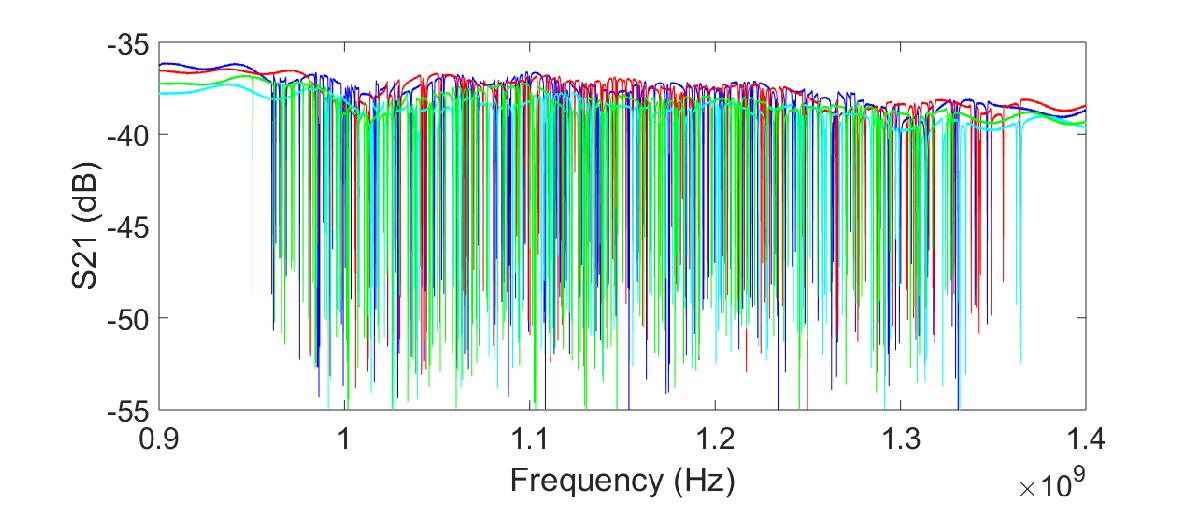
Resonance sweep for the four feedlines of the 150 GHz array. The lines 1,2,3, and 4 are shown in blue, red, cyan and green, respectively. The y-axis represents the transmission of the feedline (parameter S21) and is expressed in dB. Each dip corresponds to a resonance/pixel. At least 94% of the 616 pixels are identified with a resonance and are thus sensitive to incoming radiation.
Current usage metrics show cumulative count of Article Views (full-text article views including HTML views, PDF and ePub downloads, according to the available data) and Abstracts Views on Vision4Press platform.
Data correspond to usage on the plateform after 2015. The current usage metrics is available 48-96 hours after online publication and is updated daily on week days.
Initial download of the metrics may take a while.