Fig. 17
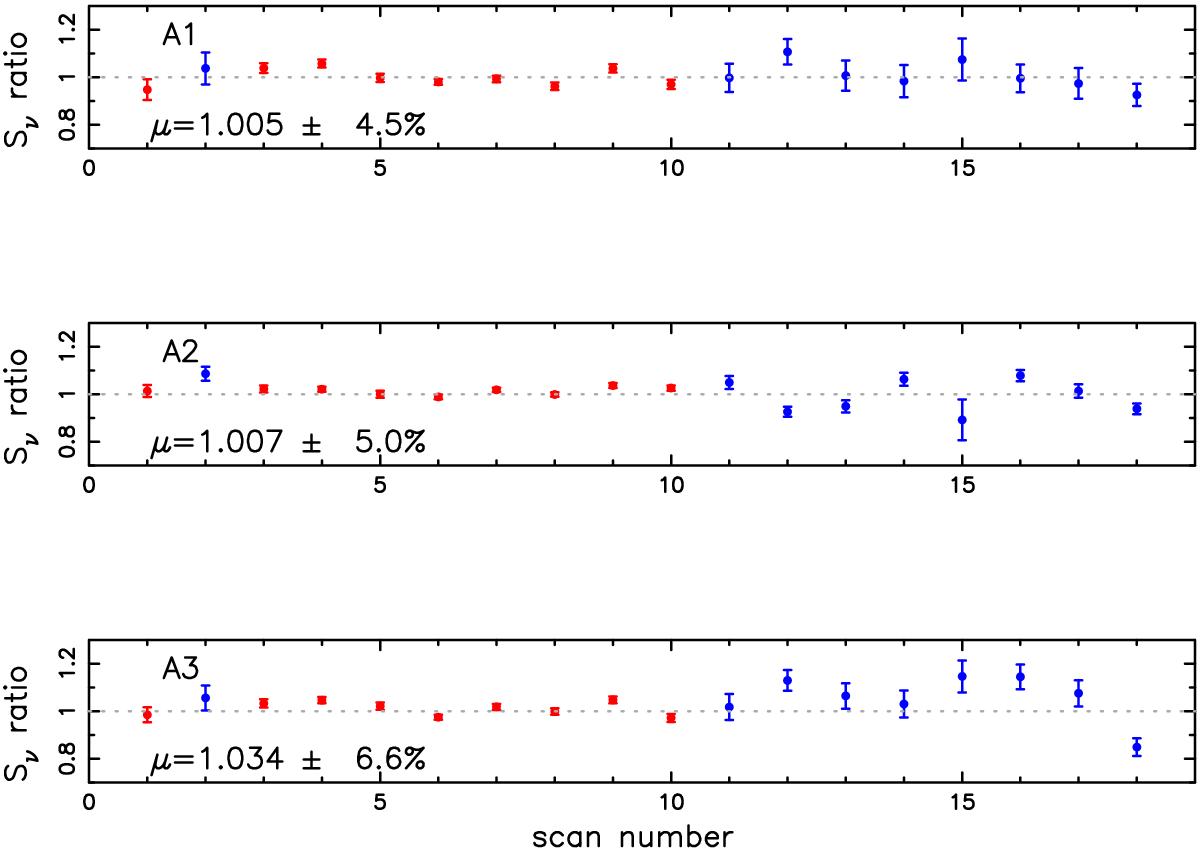
Comparison of measured and reference flux densities of the primary calibrators Uranus (red) and Neptune (blue). Their ratios are shown for the three arrays A1 (260 GHz-H), A2 (150 GHz), and A3 (260 GHz-V). The mean ratio μ and relative scatter are provided for each array. The reference flux densities are from Moreno (2010), Bendo et al. (2013). The scan numbers are time-ordered: 1 to 10 refer the period 23–28 February, 2017 (fair weather) and 11 to 18 to the period 19–25 April, 2017 (mediocre weather).
Current usage metrics show cumulative count of Article Views (full-text article views including HTML views, PDF and ePub downloads, according to the available data) and Abstracts Views on Vision4Press platform.
Data correspond to usage on the plateform after 2015. The current usage metrics is available 48-96 hours after online publication and is updated daily on week days.
Initial download of the metrics may take a while.