Fig. 16
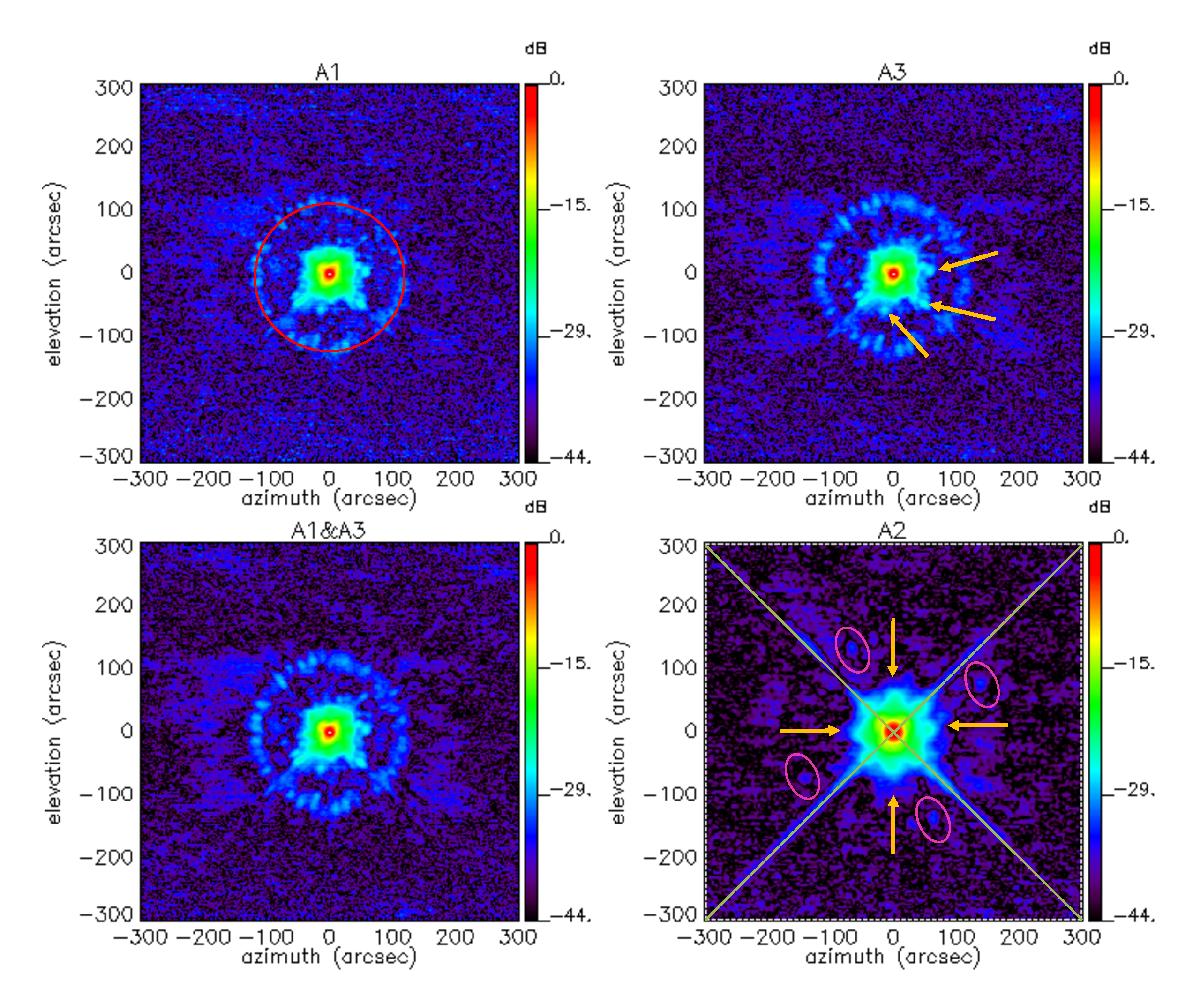
Measured beam pattern. From upper left to lower right: beam maps of arrays A1 and A3, the combination of the 260 GHz arrays (A1 & A3) and the 150 GHz array (A2) are shown in decibel. These 10′ × 10′ maps, have been constructed from the normalised combination of four relatively long scans of bright point sources. Details on the structures present in the maps are given in the text.
Current usage metrics show cumulative count of Article Views (full-text article views including HTML views, PDF and ePub downloads, according to the available data) and Abstracts Views on Vision4Press platform.
Data correspond to usage on the plateform after 2015. The current usage metrics is available 48-96 hours after online publication and is updated daily on week days.
Initial download of the metrics may take a while.