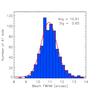
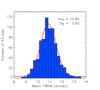
Fig. 15
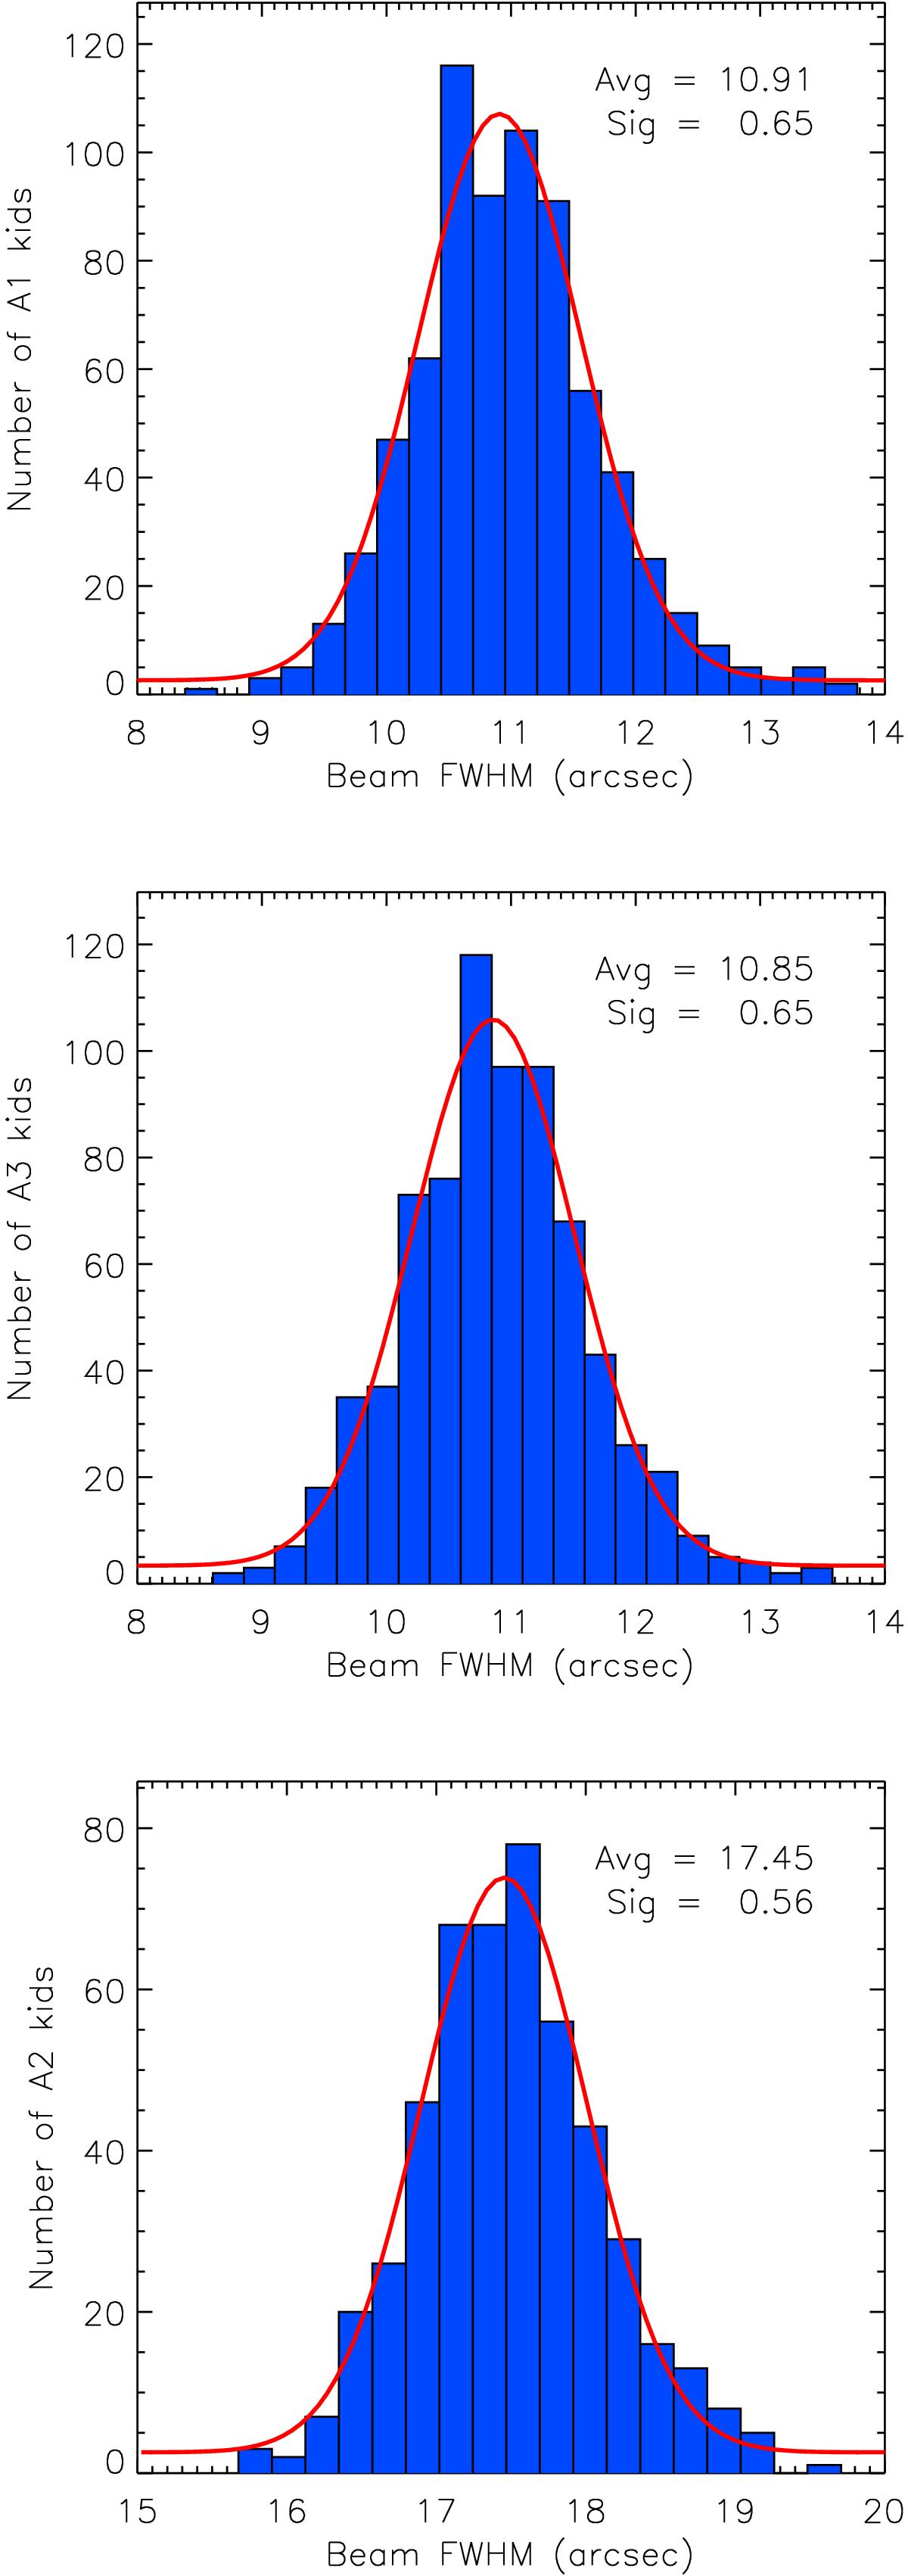
From top to bottom: main beam FWHM distribution of all valid KID detectors of arrays A1, A3, and A2. The main beam FWHM is the geometrical combination of the two-orthogonal FWHM estimates obtained from an elliptical Gaussian fit on side-lobe masked individual maps per KID (see text). The red curves show a Gaussian fit to the histogram data.
Current usage metrics show cumulative count of Article Views (full-text article views including HTML views, PDF and ePub downloads, according to the available data) and Abstracts Views on Vision4Press platform.
Data correspond to usage on the plateform after 2015. The current usage metrics is available 48-96 hours after online publication and is updated daily on week days.
Initial download of the metrics may take a while.