Fig. 14
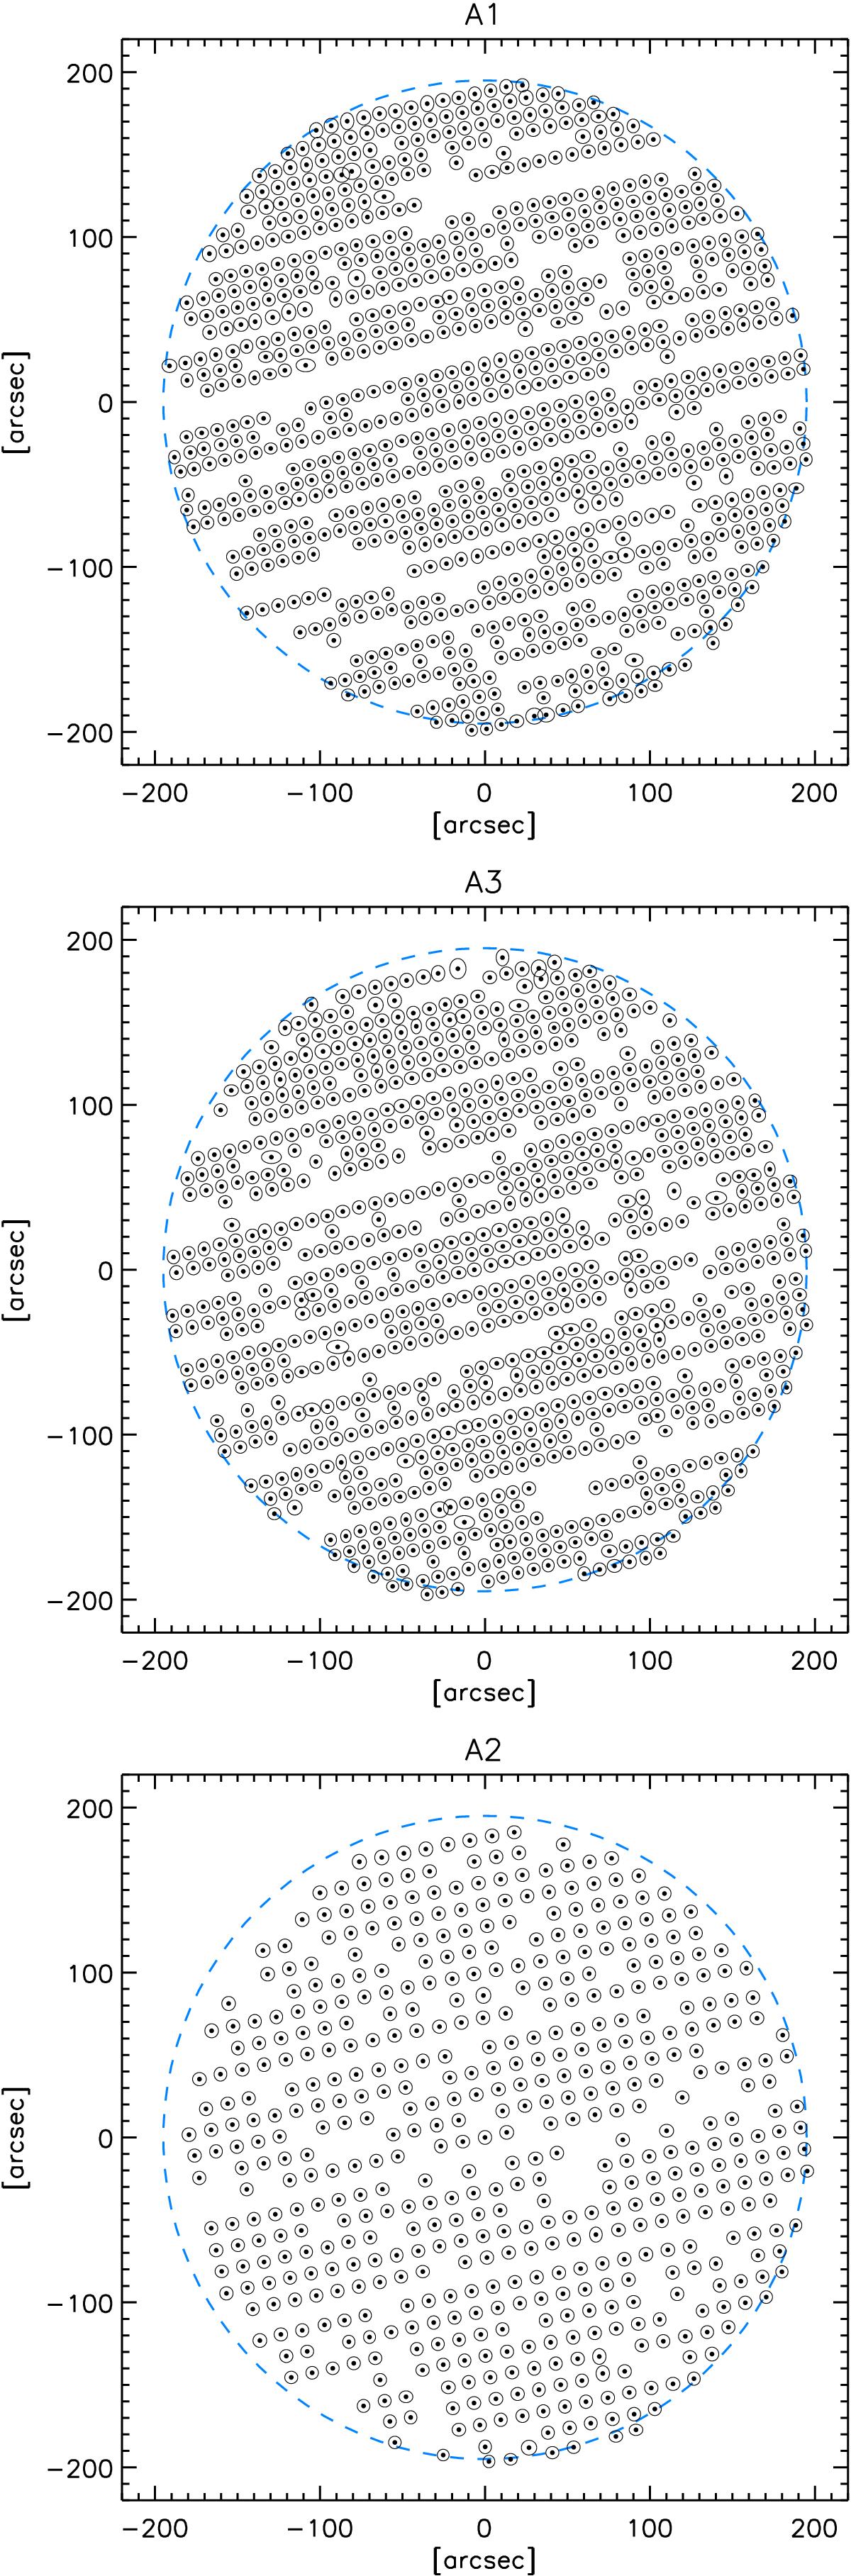
From top to bottom: detectors positions for arrays A1 (260 GHz-H), A3 (260 GHz-V), and A2 (150 GHz). The three plots show the detectors that have seen the sky and passed the quality criteria for at least two focal plane reconstructions during Run10: 952, 961, and 553 for A1, A3, and A2, respectively. The outer dashed line circle corresponds to the nominal FoV of 6.5 arcmin.
Current usage metrics show cumulative count of Article Views (full-text article views including HTML views, PDF and ePub downloads, according to the available data) and Abstracts Views on Vision4Press platform.
Data correspond to usage on the plateform after 2015. The current usage metrics is available 48-96 hours after online publication and is updated daily on week days.
Initial download of the metrics may take a while.