Fig. 10
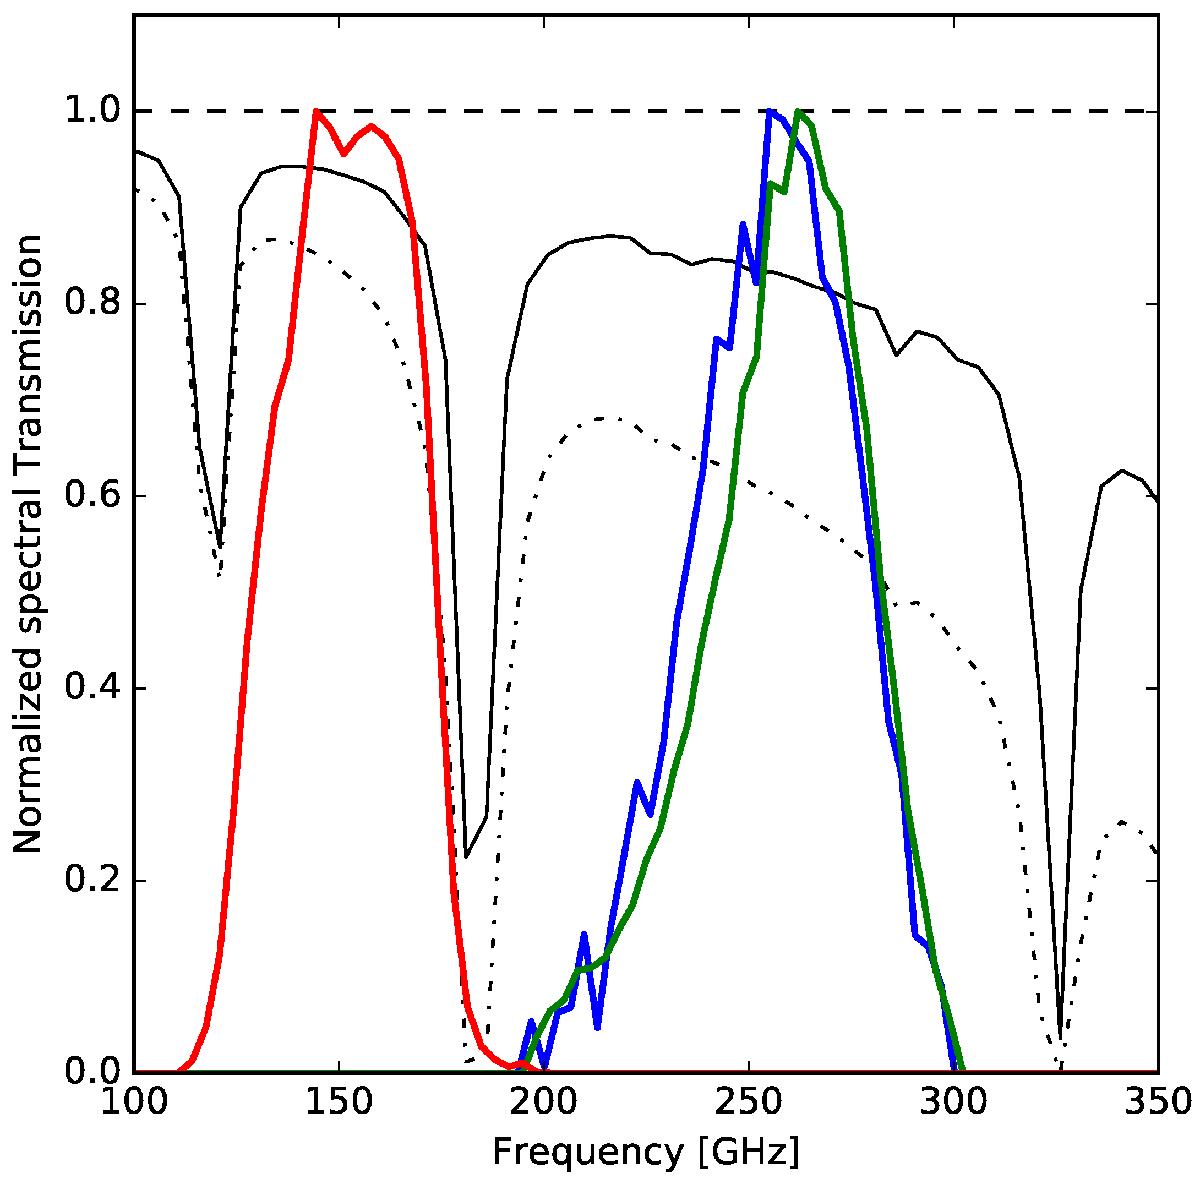
NIKA2 spectral characterisation for the two 260 GHz arrays, H (A1, blue) and V (A3, green) measured in the NIKA2 cryostat, and for the 150 GHz array (A2, red) measured in a test cryostat equipped with exact copies of the NIKA2 band-defining filters. The band transmissions are not corrected for Rayleigh-Jeans spectrum of the input source. We also show for comparison the atmospheric transmission (Pardo et al. 2002) assuming 2 mm of precipitable water vapour (PWV), that is, very good conditions, and 6 mm PWV, that is, average conditions.
Current usage metrics show cumulative count of Article Views (full-text article views including HTML views, PDF and ePub downloads, according to the available data) and Abstracts Views on Vision4Press platform.
Data correspond to usage on the plateform after 2015. The current usage metrics is available 48-96 hours after online publication and is updated daily on week days.
Initial download of the metrics may take a while.