Free Access
Fig. 3
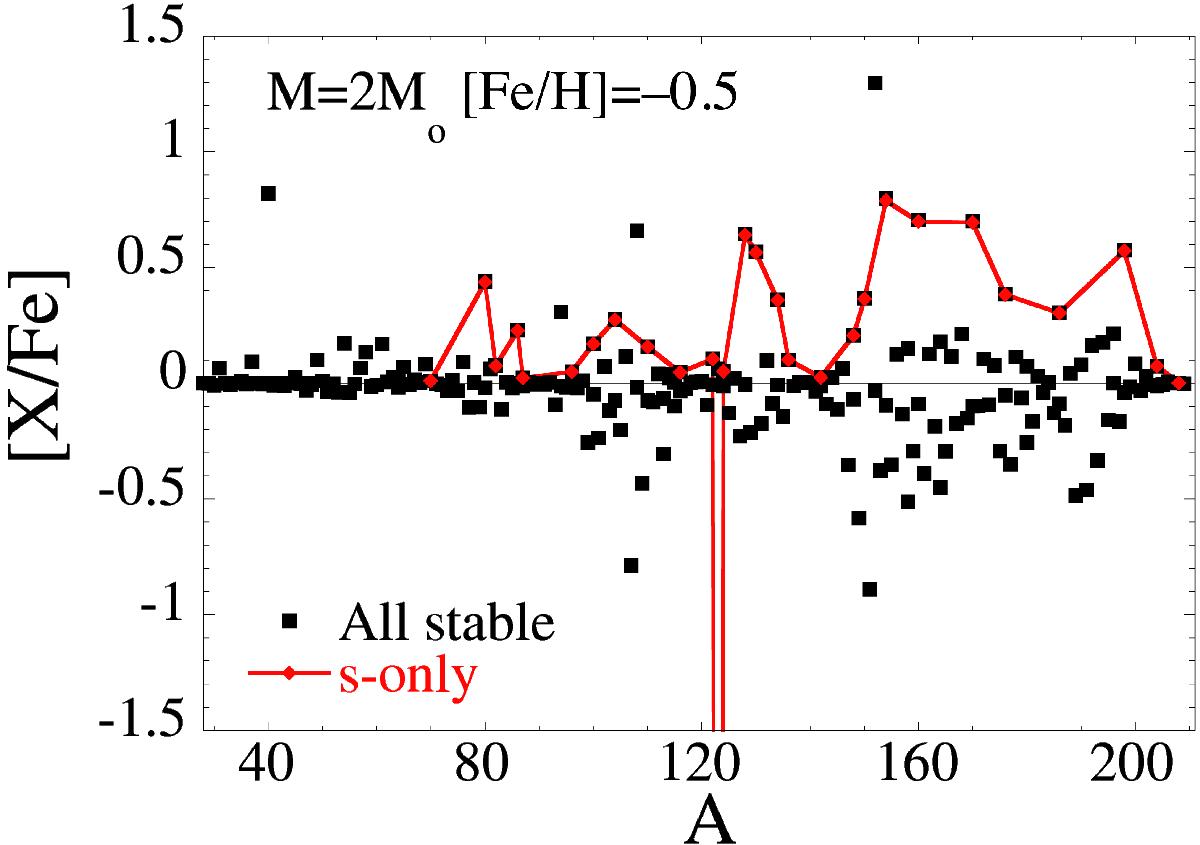
Final overproduction factors [X/Fe] of all stable nuclei with A ≥ 30 (full squares) at the center of our 2 M⊙[Fe/H] = −0.5 model star at the end of core helium burning. The s-only nuclei are shown by red diamonds connected by a solid line. The vertical line depicts the total decay of the s-only nucleus 123Te.
Current usage metrics show cumulative count of Article Views (full-text article views including HTML views, PDF and ePub downloads, according to the available data) and Abstracts Views on Vision4Press platform.
Data correspond to usage on the plateform after 2015. The current usage metrics is available 48-96 hours after online publication and is updated daily on week days.
Initial download of the metrics may take a while.