Fig. 2
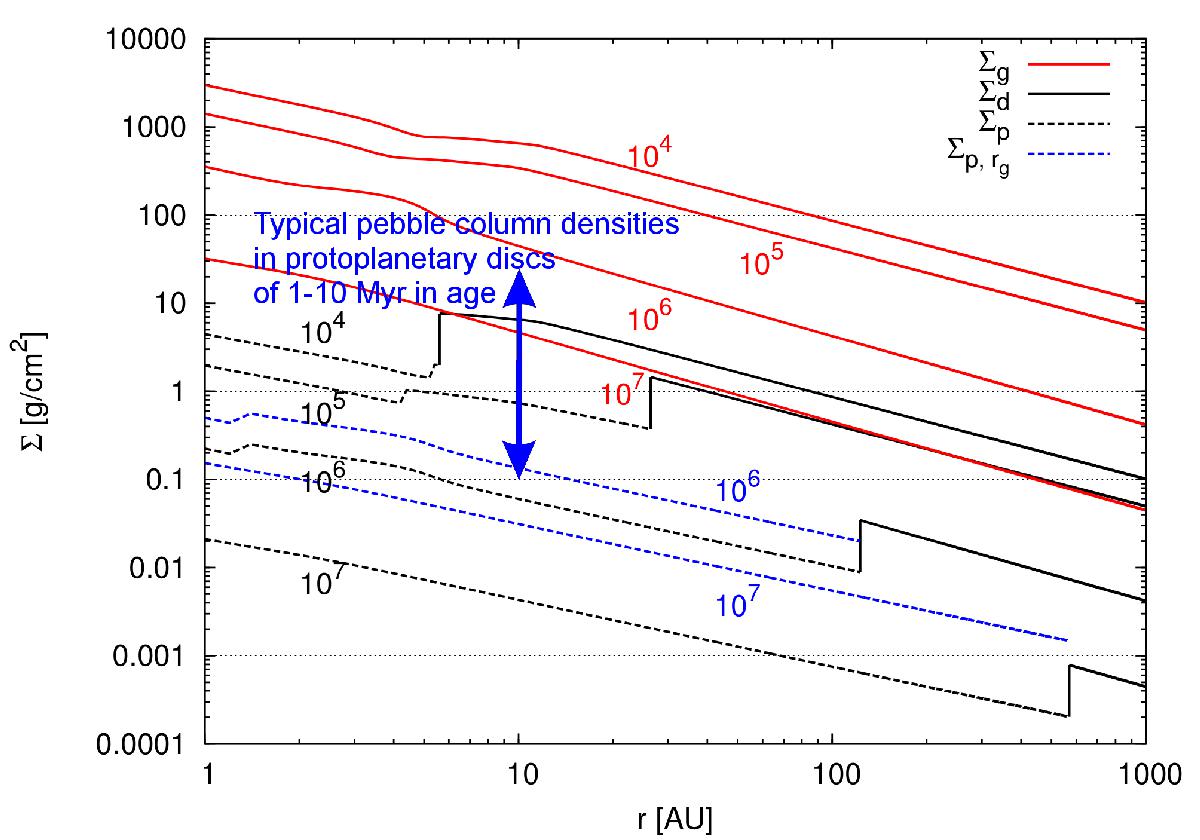
Gas surface density Σg, the dust surface density Σd and the pebble surface density Σp as a function of orbital distance and time in the disc evolution model of Bitsch et al. (2015a), which is used in the planet formation model of Bitsch et al. (2015b). The times are (top to bottom) 104, 105, 106 and 107 yr. The large bump that connects the pebble surface density with the dust surface density indicates the pebble production line rg. The blue lines correspond to the pebble surface density calculated with a frozen dust distribution outside of 50 AU (Sect. 2.2). The blue arrow indicates the typical pebble surface densities inferred at 10 AU from observations of protoplanetary discs (Williams & Cieza 2011).
Current usage metrics show cumulative count of Article Views (full-text article views including HTML views, PDF and ePub downloads, according to the available data) and Abstracts Views on Vision4Press platform.
Data correspond to usage on the plateform after 2015. The current usage metrics is available 48-96 hours after online publication and is updated daily on week days.
Initial download of the metrics may take a while.