Fig. 8
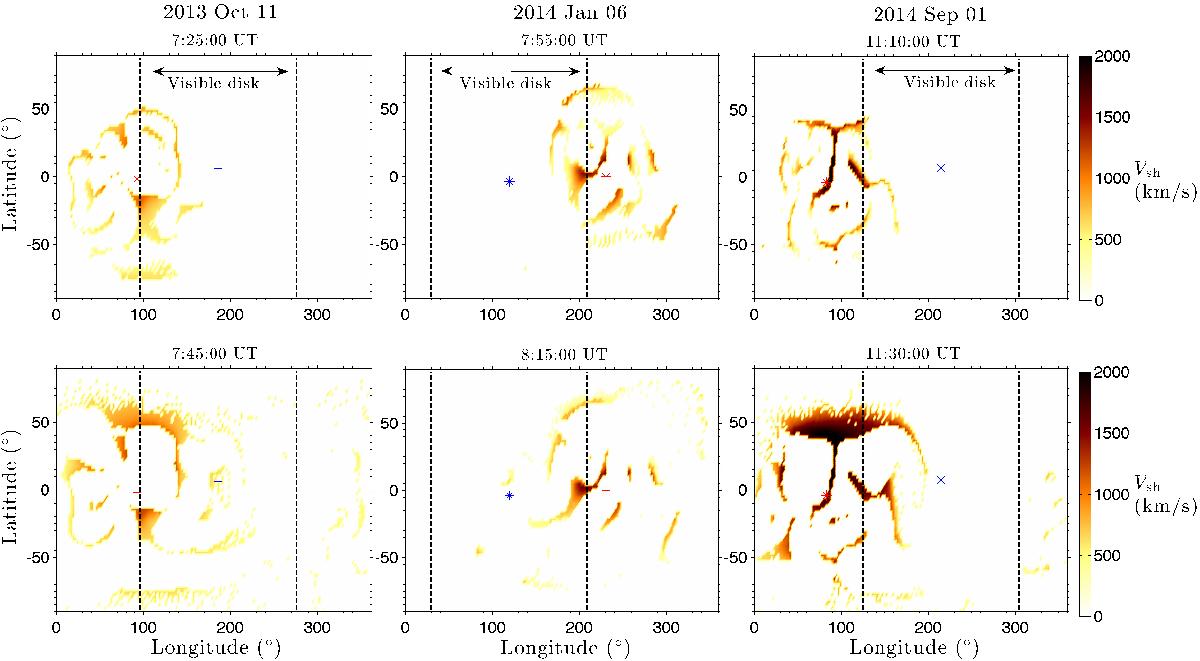
Carrington maps showing the footpoints of magnetic field lines connected to the modeled shock front 10 min and 30 min after the flare onset derived with the MAST model. Color coding follows the value of the shock front speed Vsh magnetically connected to the corresponding solar surface location. The vertical dashed lines mark the approximate location of the solar limbs as viewed from Earth and the blue cross marks the location of the center of the disk. The flare location or equivalently the CME source region is shown as a red cross.
Current usage metrics show cumulative count of Article Views (full-text article views including HTML views, PDF and ePub downloads, according to the available data) and Abstracts Views on Vision4Press platform.
Data correspond to usage on the plateform after 2015. The current usage metrics is available 48-96 hours after online publication and is updated daily on week days.
Initial download of the metrics may take a while.