Fig. 7
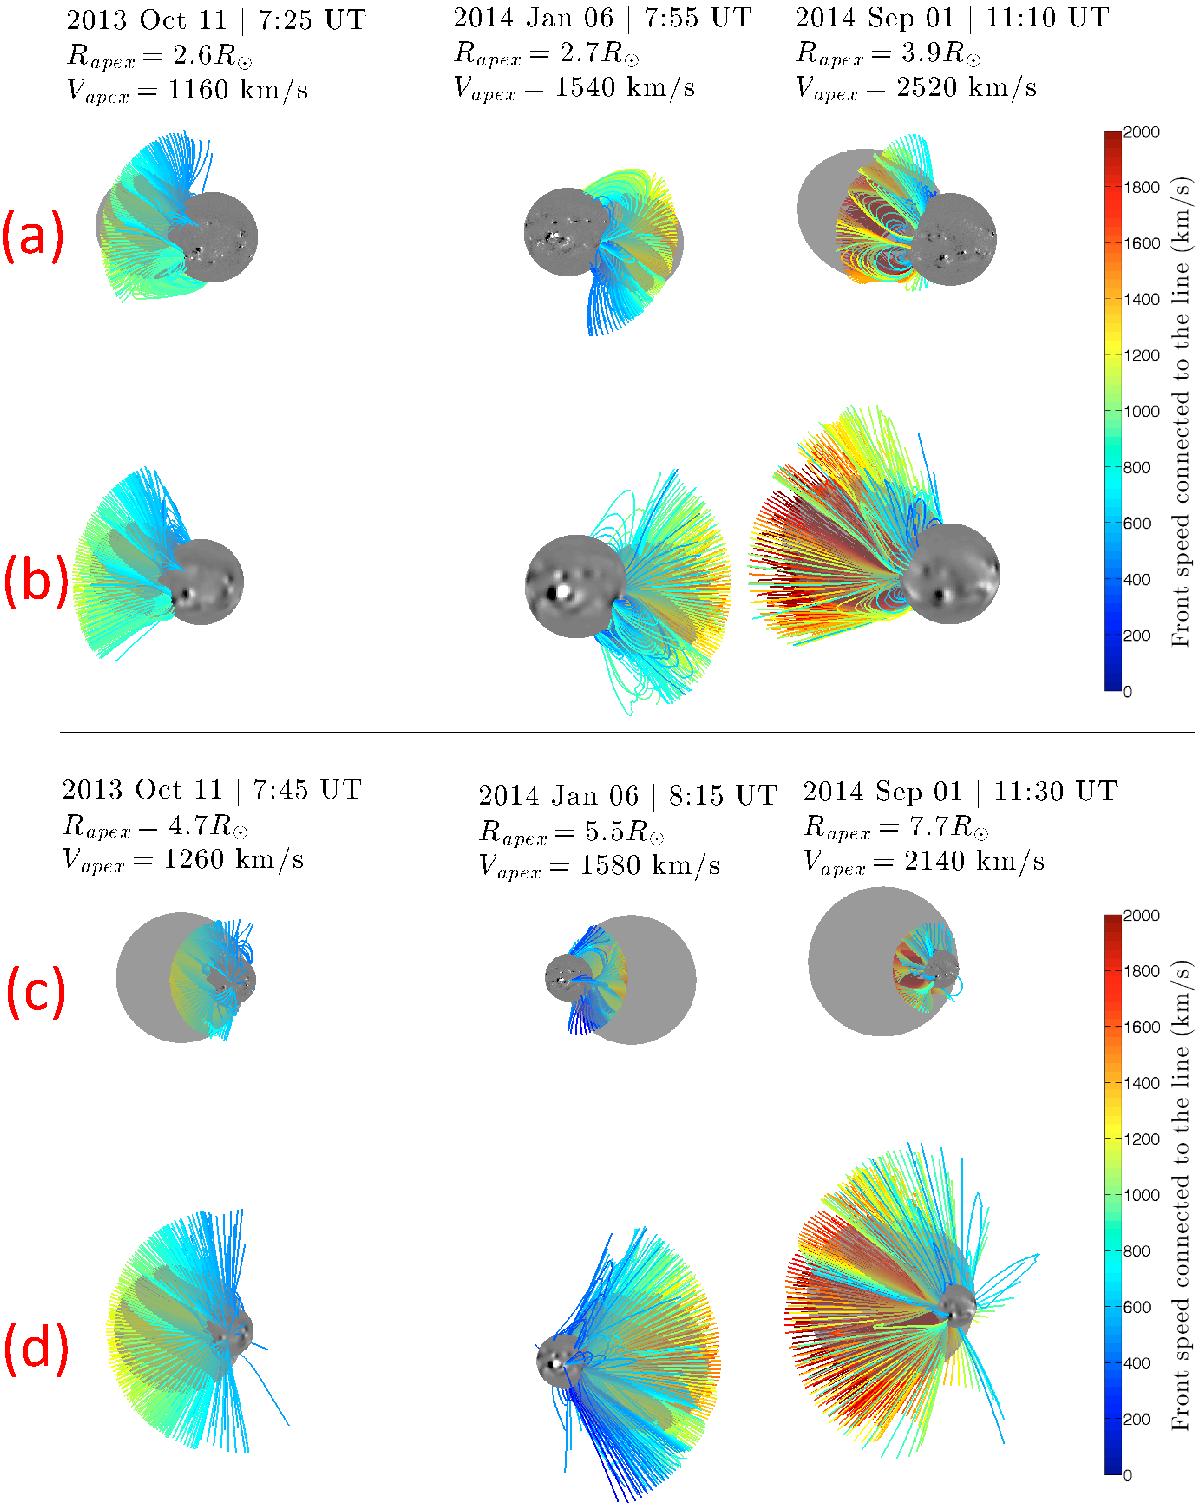
Lines of connectivity between the shock front (smooth gray ellipsoid) and the Sun (SDO images) as viewed from Earth 10 and 30 min after the type III radio event for the PFSS (a, c) and MAST (b, d) models for the three events. The color coding of the lines depicts the shock speed at the point of intersection of the field line with the shock surface. We do not plot the assumed radial field lines above the source surface at 2.5 R⊙ for the PFSS model (rows a and c).
Current usage metrics show cumulative count of Article Views (full-text article views including HTML views, PDF and ePub downloads, according to the available data) and Abstracts Views on Vision4Press platform.
Data correspond to usage on the plateform after 2015. The current usage metrics is available 48-96 hours after online publication and is updated daily on week days.
Initial download of the metrics may take a while.