Fig. 6
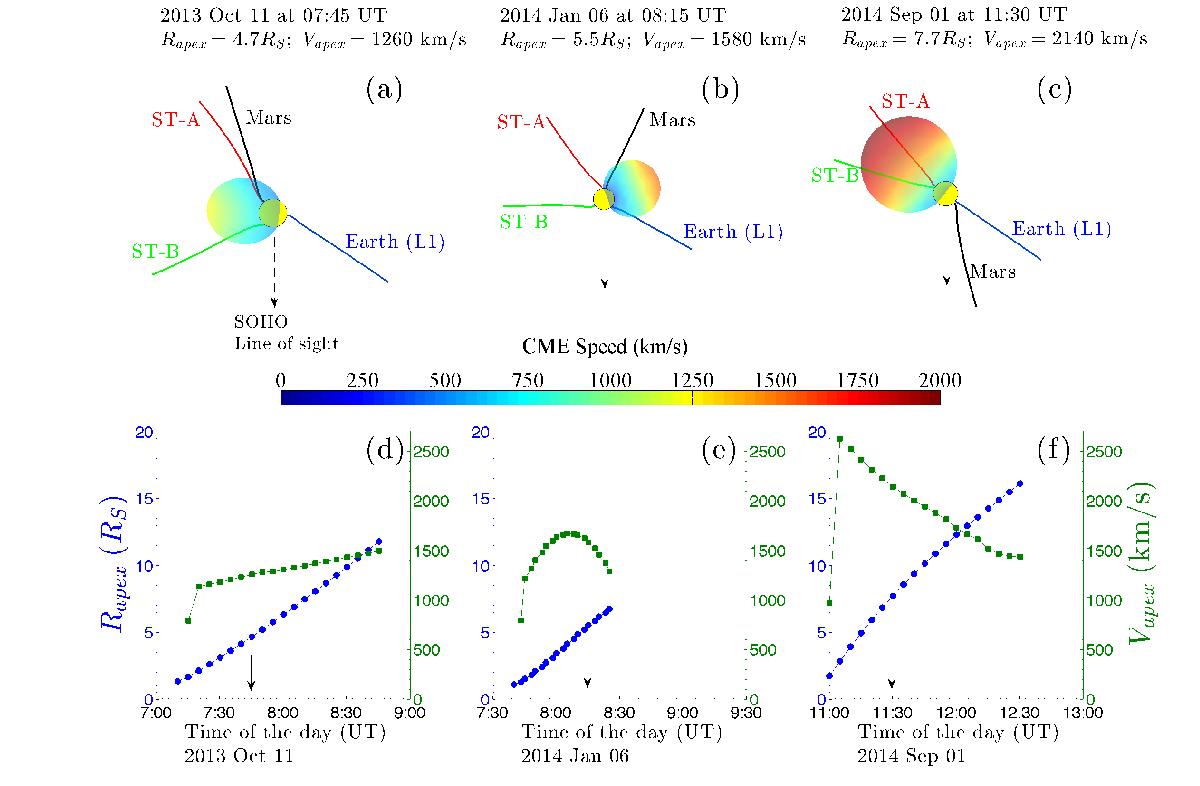
Top panels a–c: three views of the ecliptic plane from solar north depicting the ellipsoids of the three CME relative to the Sun (drawn as a yellow filled circle) approximatively 30 min after the accompanying type II radio bursts. The downward arrows depict the Earth’s location. The derived 3D shock speeds determined by the triangulation technique are shown by the coded colors superimposed on the ellipsoids. The four colored lines depict the magnetic field lines, which are connected to the spacecraft making in situ measurements. Bottom panels d–f: the time variation of the derived speed and heliocentric distance of the apex of the CME front for the three CME events. The black vertical arrows indicate the times corresponding to the snapshots in the top panels.
Current usage metrics show cumulative count of Article Views (full-text article views including HTML views, PDF and ePub downloads, according to the available data) and Abstracts Views on Vision4Press platform.
Data correspond to usage on the plateform after 2015. The current usage metrics is available 48-96 hours after online publication and is updated daily on week days.
Initial download of the metrics may take a while.