Fig. 3
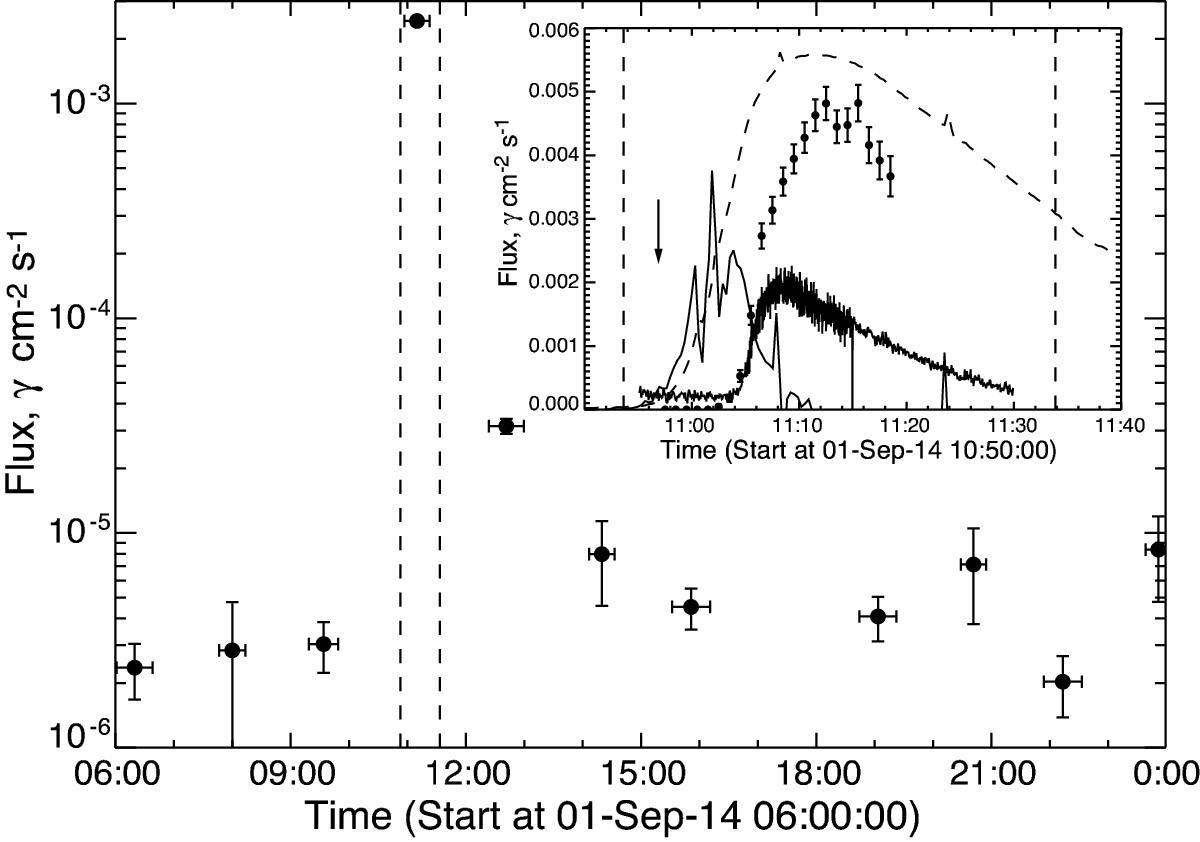
Time history of the >100 MeV flux from ≤10° of the Sun revealing the 2014 Sep. 01 LAT event. Vertical dashed lines show the estimated soft X-ray start and end times from the SAX instrument on MESSENGER that directly observed the flare. The inset shows 1-min accumulation LAT flux data points and arbitrarily scaled 100–300 keV count rates observed by Fermi/GBM. The dashed curve shows the 1–4 keV time profile observed by the SAX instrument. The vertical solid arrow depicts our estimate of the CME onset from inspection of SDO/AIA images and the type II radio emission began about 3 min later. The derivative of the 1–4 keV emission plotted as the thin solid curve is an estimate of the hard X-ray time profile at the flare site.
Current usage metrics show cumulative count of Article Views (full-text article views including HTML views, PDF and ePub downloads, according to the available data) and Abstracts Views on Vision4Press platform.
Data correspond to usage on the plateform after 2015. The current usage metrics is available 48-96 hours after online publication and is updated daily on week days.
Initial download of the metrics may take a while.