Fig. A.3
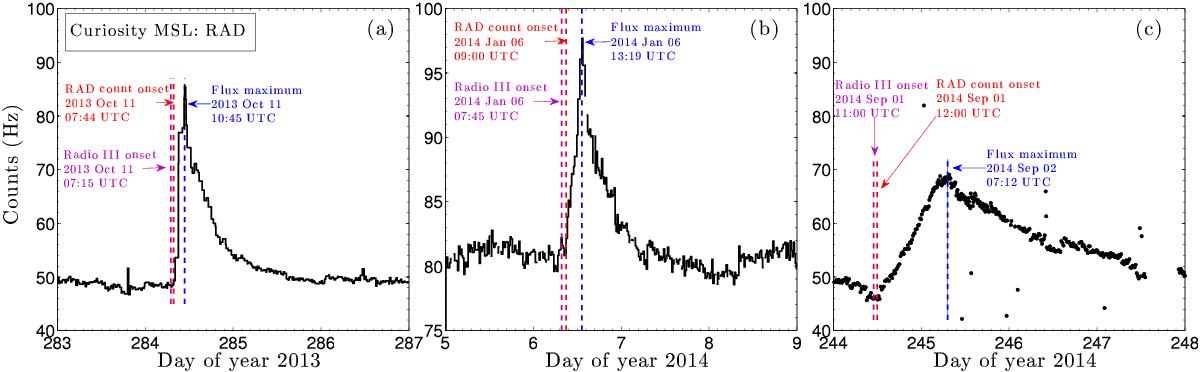
Time series of the counts of energetic particles per second by the RAD instrument on the Mars Science Laboratory’s Curiosity Rover for the three events: a) 2013 Oct. 11, b) 2014 Jan. 06 and c) 2014 Sep. 01. Solar radio type III time, particle counts onset time and the time of the peak flux are indicated by the magenta, red and blue vertical dashed lines, respectively.
Current usage metrics show cumulative count of Article Views (full-text article views including HTML views, PDF and ePub downloads, according to the available data) and Abstracts Views on Vision4Press platform.
Data correspond to usage on the plateform after 2015. The current usage metrics is available 48-96 hours after online publication and is updated daily on week days.
Initial download of the metrics may take a while.