Fig. 12
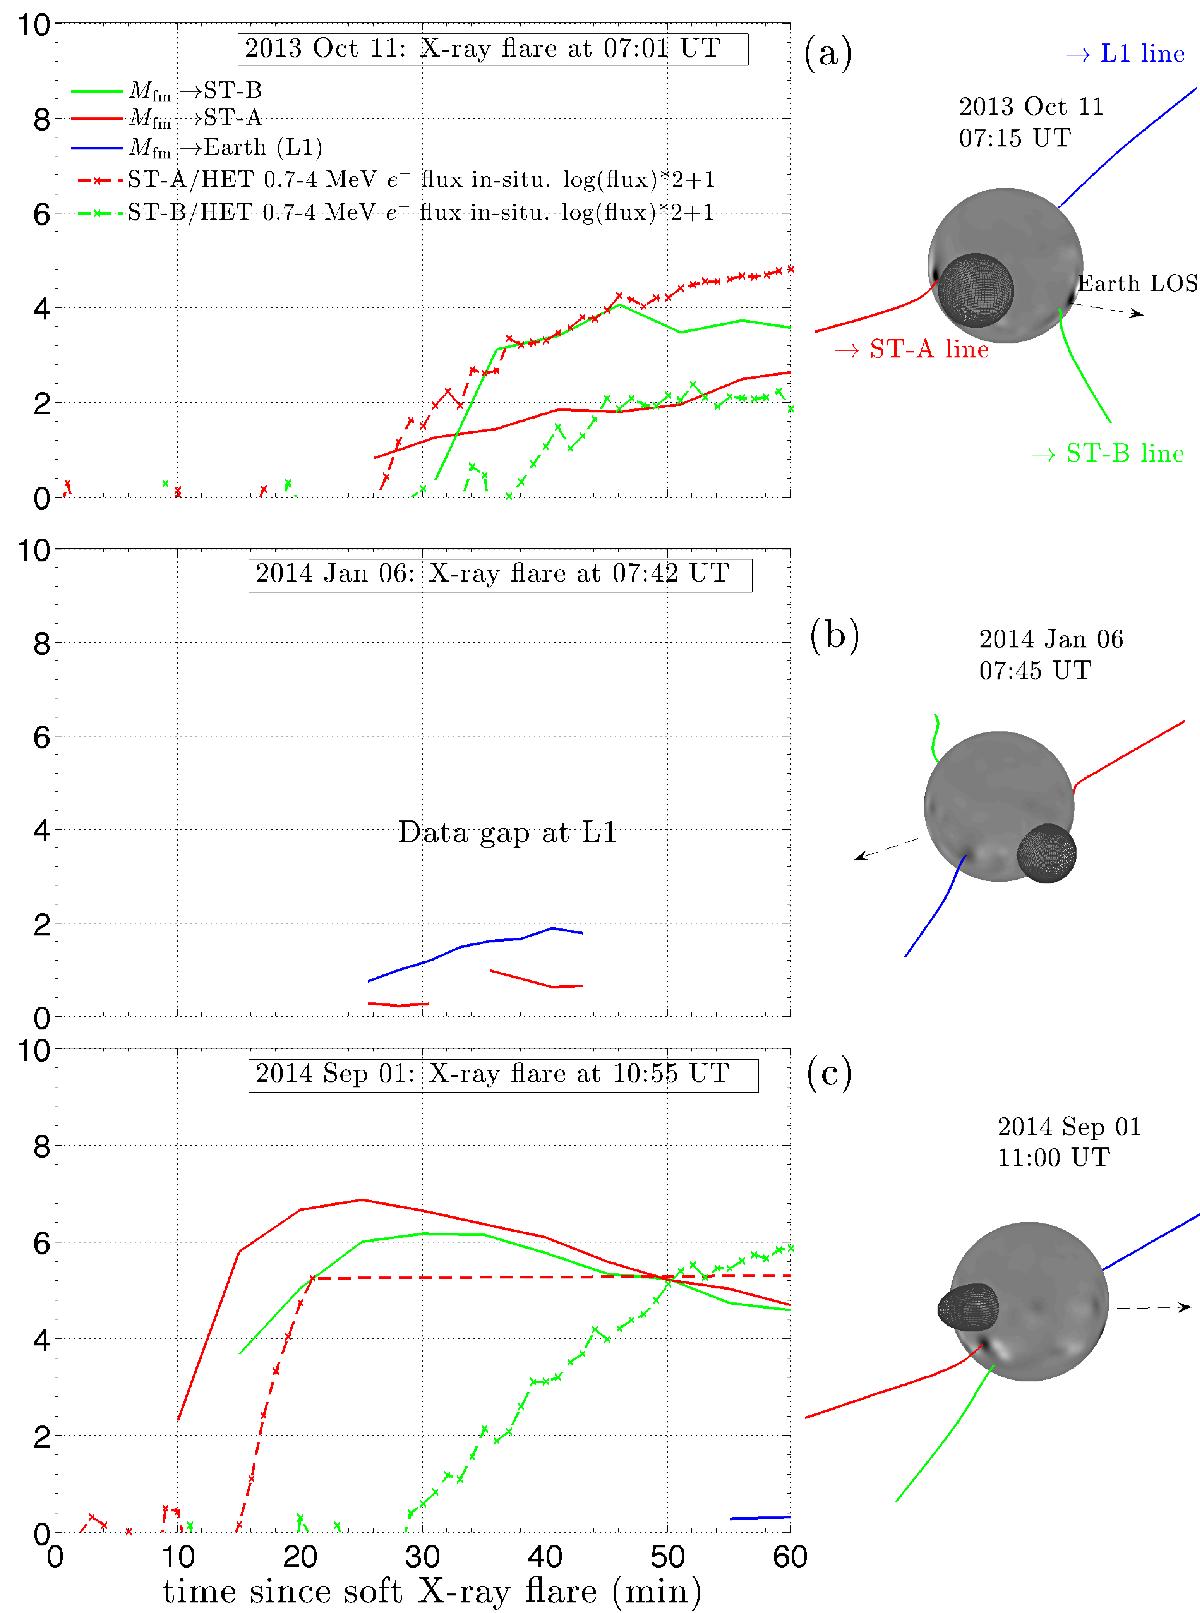
First 60 min of the three events, 2013 Oct. 11 (panel a), 2014 Jan. 06 (panel b) and 2014 Sep. 01 (panel c) where we show the time series of Mach numbers at the sites where the shock fronts intersect the field lines crossing the locations of STEREO-A line (solid red line), STEREO-B line (solid green line), and L1(solid blue line). These times have been corrected for ~11 min electron propagation time along the Parker spiral. The in situ energetic electron fluxes in the 0.7−4 MeV energy band are plotted with dotted lines: red for STEREO-A and green for STEREO-B. Time 0 is defined by the soft-X ray flux onset as observed from MESSENGER. The right-hand panels show the magnetic connectivity field lines, along with the early post-flare shapes of the coronal shocks, near the times of the radio type II onsets. The dashed black arrows indicate the line of sight as seen from the Earth.
Current usage metrics show cumulative count of Article Views (full-text article views including HTML views, PDF and ePub downloads, according to the available data) and Abstracts Views on Vision4Press platform.
Data correspond to usage on the plateform after 2015. The current usage metrics is available 48-96 hours after online publication and is updated daily on week days.
Initial download of the metrics may take a while.