Fig. 11
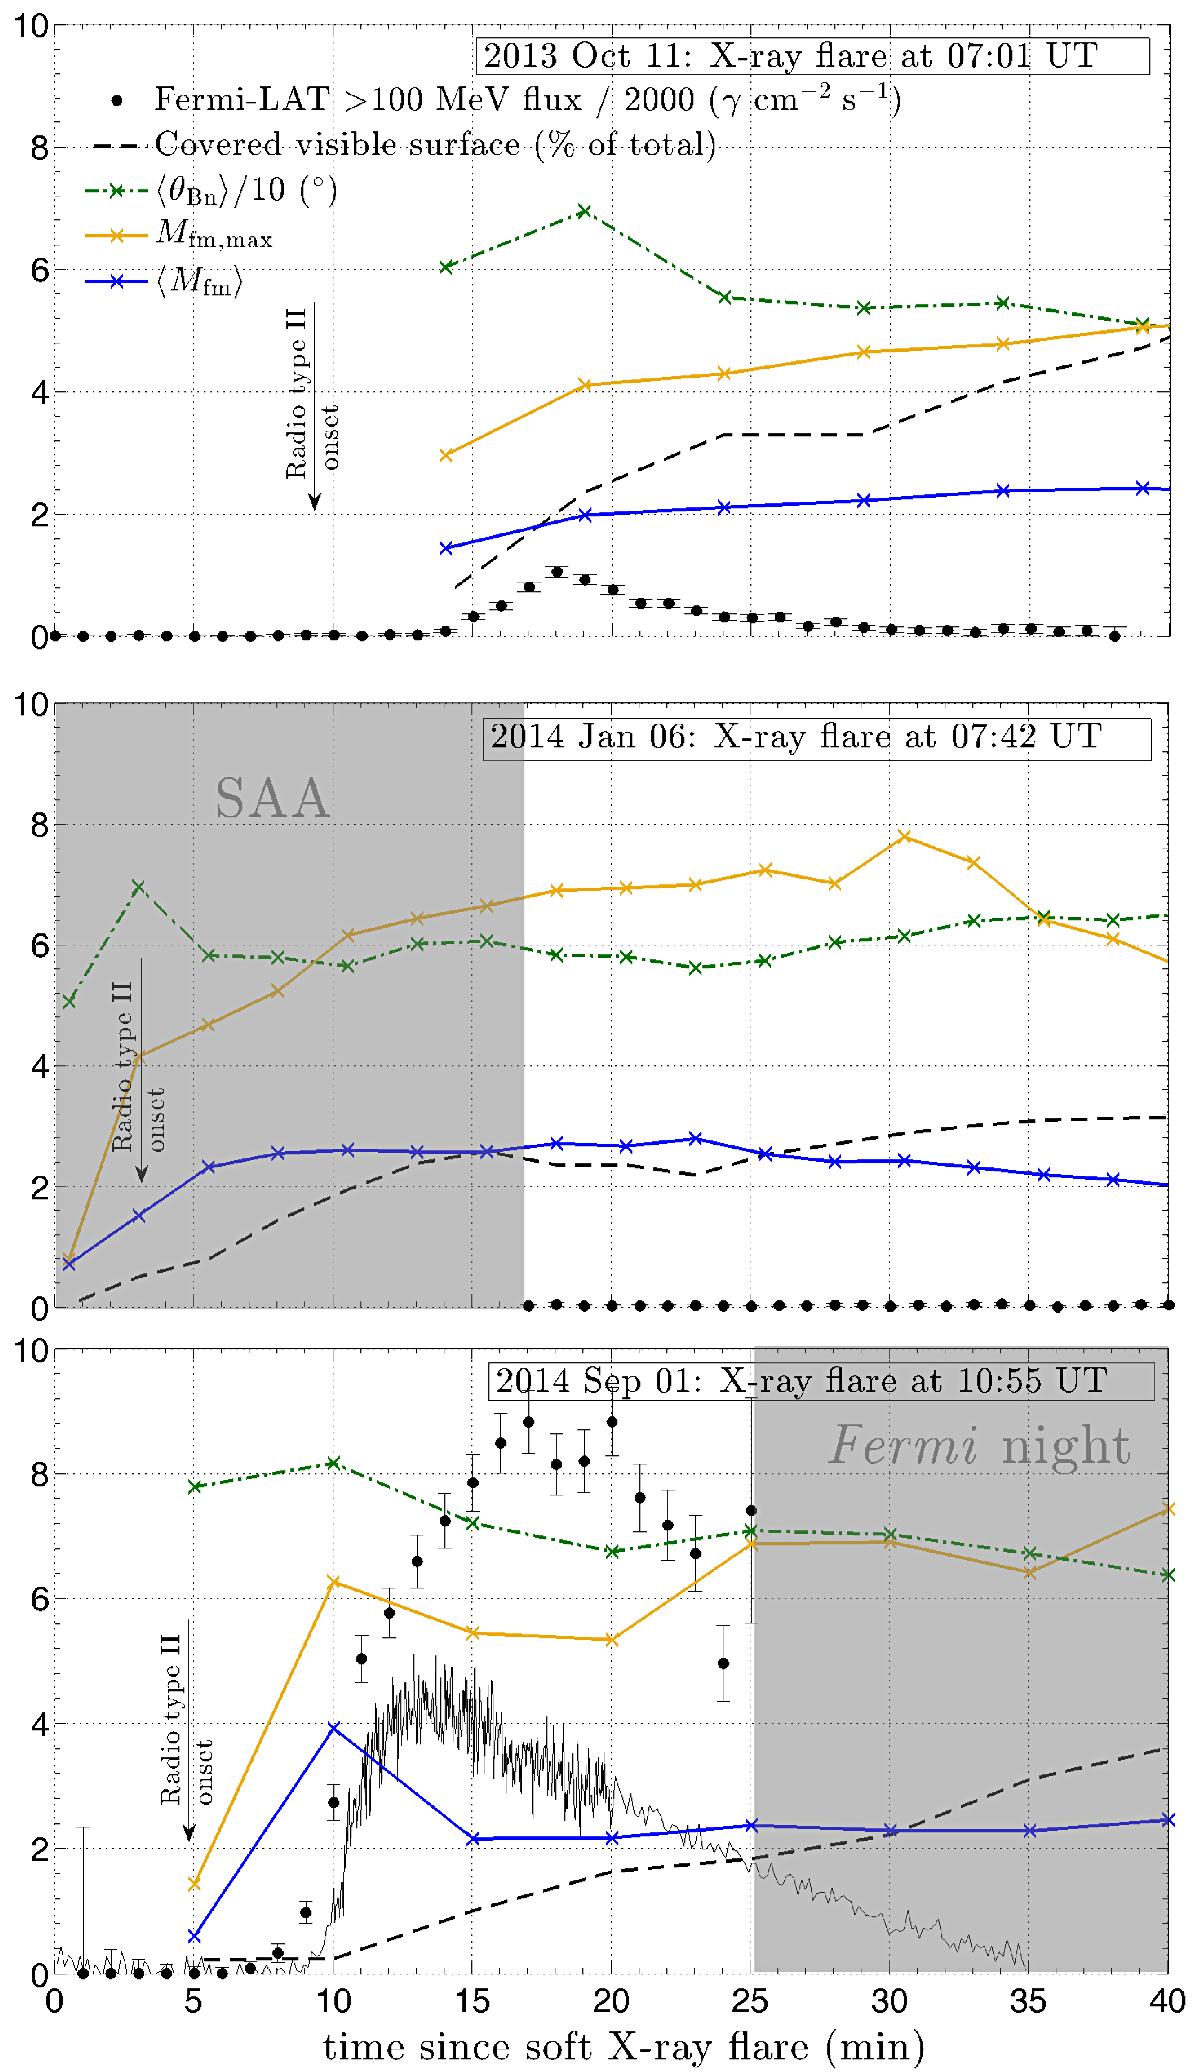
First 40 min of the three events: 2013 Oct. 11 (top), 2014 Jan. 06 (middle), and 2014 Sep. 01 (bottom). We show time series of the maximum Mach number (Mfm,max; orange line), the average Mach number (⟨ Mfm ⟩, blue line), and the average shock geometry ⟨ θBn ⟩ divided by 10 (green dot-dashed line) derived for all magnetic field lines connected to the visible solar disk. The times at which these quantities where derived are denoted with “x” symbols over the lines. The fraction of the visible solar surface magnetically connected to the shocks is also shown as a dashed black line. Time 0 is defined by the rise in soft X-ray flux. The onset of the metric type II bursts are indicated by vertical arrows and the greater than 100 MeV γ-ray flux measured by the Fermi-LAT instrument is shown as filled black circles with corresponding error bars. The γ-ray fluxes presented in the three panels are all multiplied by factor of 2000 for plotting purposes. Times when the Fermi-LAT instruments were not observing the Sun are shown as gray shaded areas. In panel c the solid black curve represents the arbitrarily scaled 100–300 keV count rates observed by the GBM.
Current usage metrics show cumulative count of Article Views (full-text article views including HTML views, PDF and ePub downloads, according to the available data) and Abstracts Views on Vision4Press platform.
Data correspond to usage on the plateform after 2015. The current usage metrics is available 48-96 hours after online publication and is updated daily on week days.
Initial download of the metrics may take a while.