Fig. 10
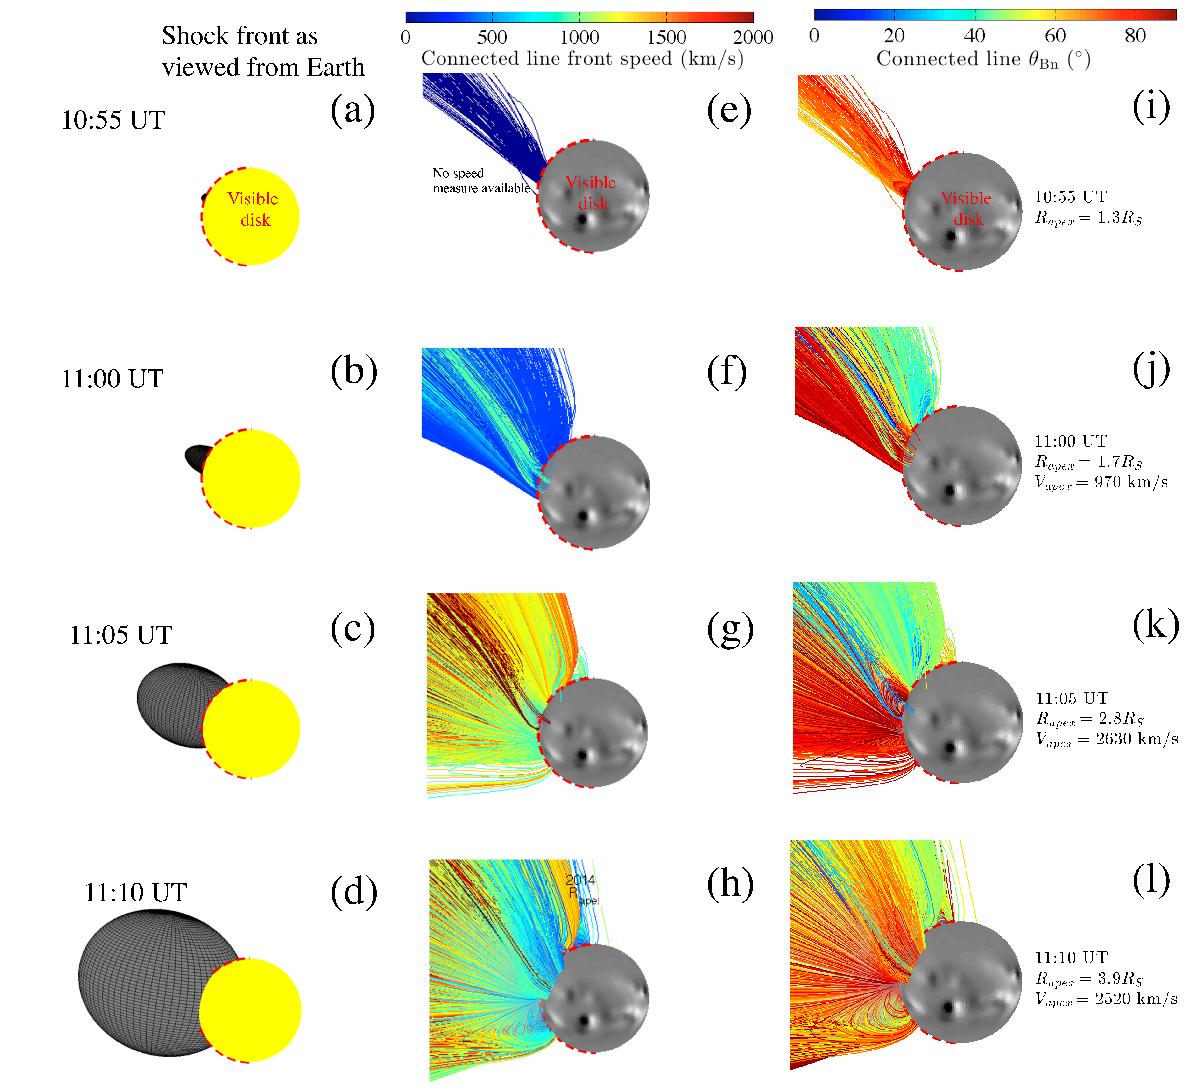
Temporal evolution of the shock front and magnetic connectivity to the solar atmosphere early in the 2014 Sep. 01 event derived via the MAST model. Left column (panels a–d) presents the 3D ellipsoid approximation to the pressure-wave front at 10:55, 11:00, 11:05, and 11:10 UT, respectively, derived from our CME triangulation studies. The visible solar disk is drawn as a yellow sphere delineated by the red dashed line. The corresponding magnetic field lines color coded by the shock-front speed are plotted in the central column (panels e–h). The same lines, coded by the value of the magnetic field inclination to the shock-normal θBn, are plotted in the right column (panels i–l). The Sun is represented by a generic magnetogram. The color-coded scales are given at the top of the figure.
Current usage metrics show cumulative count of Article Views (full-text article views including HTML views, PDF and ePub downloads, according to the available data) and Abstracts Views on Vision4Press platform.
Data correspond to usage on the plateform after 2015. The current usage metrics is available 48-96 hours after online publication and is updated daily on week days.
Initial download of the metrics may take a while.