Fig. 5
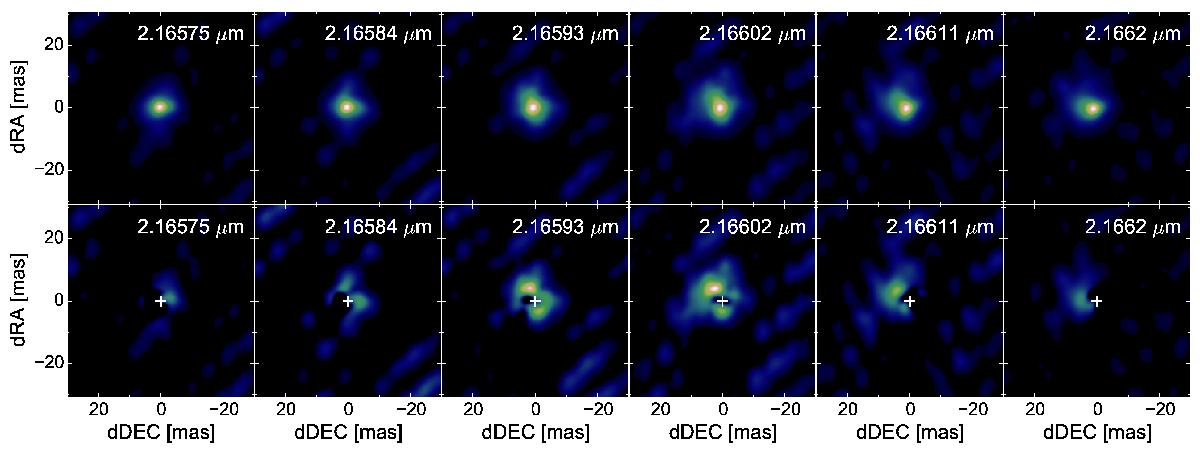
Velocity-resolved aperture synthesis images of MWC297 calculated by applying the IRBis software to our AMBER HR-K data. The raw images are shown in the upper panel and the continuum-corrected images are shown in the lower panel. The corresponding wavelength for each spectral channel is shown in the upper right corner of each image and the location of the continuum center is marked as a white cross in the continuum-corrected images.
Current usage metrics show cumulative count of Article Views (full-text article views including HTML views, PDF and ePub downloads, according to the available data) and Abstracts Views on Vision4Press platform.
Data correspond to usage on the plateform after 2015. The current usage metrics is available 48-96 hours after online publication and is updated daily on week days.
Initial download of the metrics may take a while.