Fig. 4
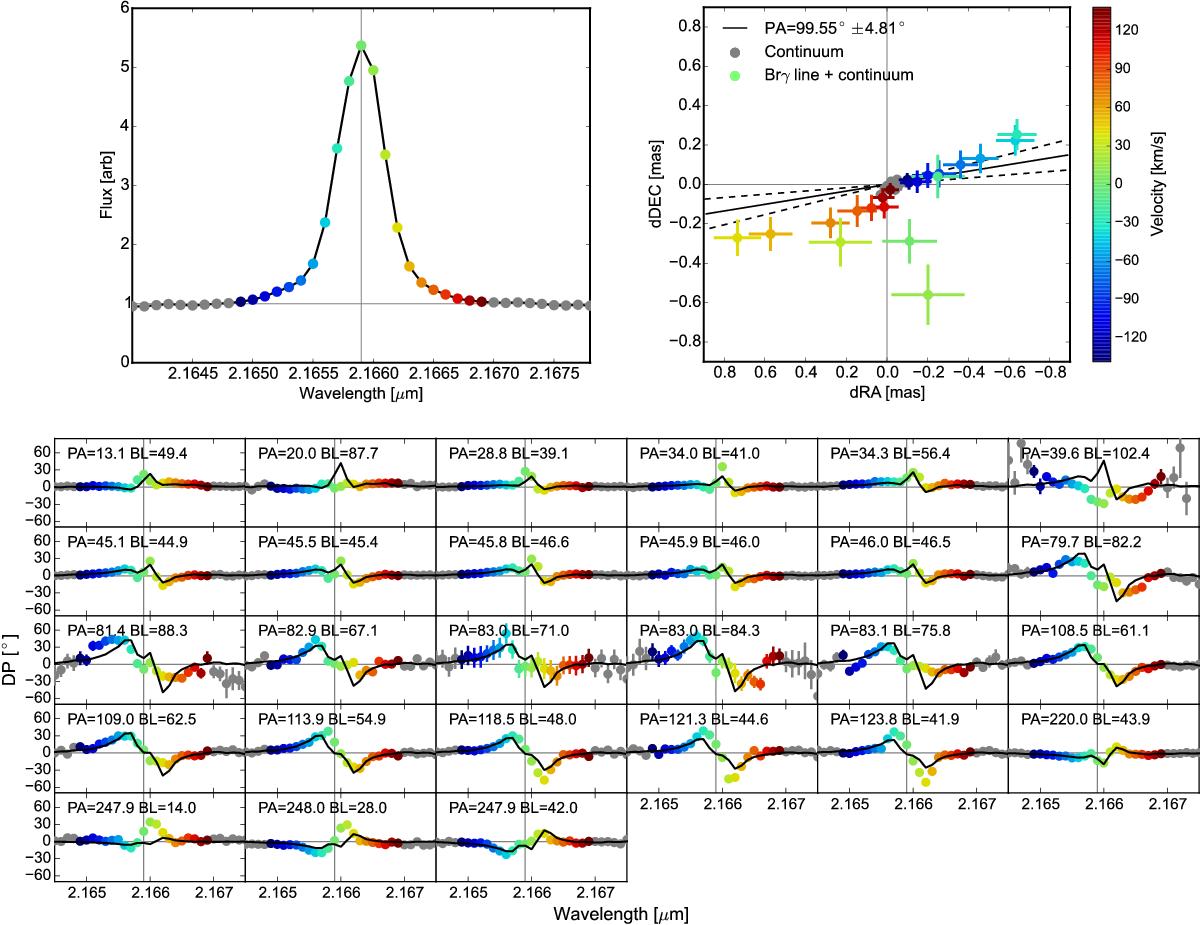
Upper left panel: K-band spectrum of MWC297 measured with AMBER, averaged across all baselines. Upper right panel: derived 2D photocenter displacement vectors for the Brγ line + continuum determined from our AMBER HR-K data. The black line shows the position angle of the disk major axis determined from our AMBER LR observations. Lower panel: differential phases for MWC297 observed with AMBER (circular points) compared with differential phases corresponding to the photocenter shifts shown in the upper right panel of this figure (black lines). The frame with PA = 39.6, BL = 102.4 is offset by 180° in order to see the differential phase changes at the Brγ line center.
Current usage metrics show cumulative count of Article Views (full-text article views including HTML views, PDF and ePub downloads, according to the available data) and Abstracts Views on Vision4Press platform.
Data correspond to usage on the plateform after 2015. The current usage metrics is available 48-96 hours after online publication and is updated daily on week days.
Initial download of the metrics may take a while.